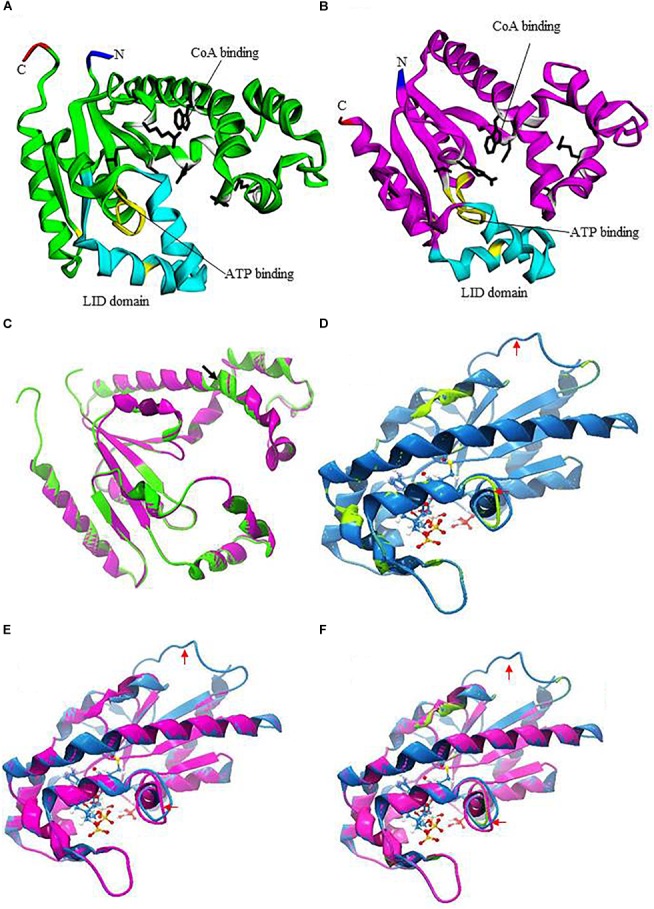
FIGURE 1.

Prediction of three-dimensional structures of EhDPCKs using Mus musculus COASY as the Pyre 2 homology model. (A) A predicted structure of EhDPCK1 (accession number: XP_648971). The region implicated in the ATP binding is marked in yellow; the side chains of the residues involved in the CoA binding are marked with white ribbons with black sticks; and LID domain is depicted with cyan ribbons. The amino and carboxyl termini are marked in blue and red, respectively. The remaining regions are shown in green. (B) A predicted structure of EhDPCK2 (accession number: XP_655761). The region implicated in the ATP binding is marked in yellow; side chains of the residues involved in the CoA binding are marked with white ribbons with black sticks; and LID domain is depicted with cyan ribbons. The amino and carboxyl termini are marked in green and red, respectively. The remaining regions are shown in purple. (C) Superimposition of EhDPCK1 (green) and EhDPCK2 (pink). Structures shown in (C–F) are rotated 180° around the axis shown in (A) of the structure shown in (A,B). Black arrowhead indicated an additional β-sheet in EhDPCK1, but the 3-residue beta sheet is flanked by two alpha helices and thus it is not obvious. (D) Superimposition of the EhDPCK1 (green) on M. musculus COASY (PDB ID: 2F6R) (blue). ATP is shown with sticks and balls. (E) Superimposition of the EhDPCK2 (pink) on M. musculus COASY (blue). (F) Superimposition of the EhDPCK1 (green) and EhDPCK2 (pink) on M. musculus COASY (blue). Red arrows indicate the different area between EhDPCKs and M. musculus COASY.
