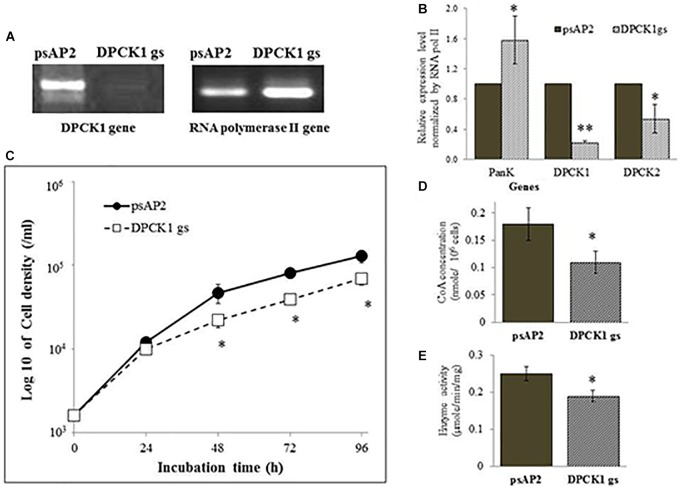
FIGURE 2.
The dpck gene expression, cell growth, CoA concentration, and DPCK activity in Ehdpck1 gene-silenced (gs) strain. (A) RT-PCR of Ehdpck1 and RNA polymerase II genes from cDNA of E. histolytica transformants. “psAP2” indicates G3 strain transfected with mock psAP-2-Gunma vector, and “DPCK1 gs” indicates GS strain transfected with Ehdpck1 gene silencing plasmid. (B) Relative levels of gene transcripts encoding EhPanK, EhDPCK1, and EhDPCK2 involved in CoA biosynthesis, estimated by qRT-PCR analysis in psAP2 and Ehdpck1 gs transformants. qRT-PCR data were normalized against RNA polymerase II, and are shown in percentage relative to the transcript level of each gene in psAP2 control. (C) Growth kinetics of E. histolytica transformants in BI-S-33 medium. (D) CoA concentrations in cell lysates. (E) DPCK activity in cell lysates of psAP2 and Ehdpck1 gs transformants. Data shown in mean ± SE. Statistical comparison is made by Student’s t-test (∗P < 0.05, ∗∗P < 0.01).

