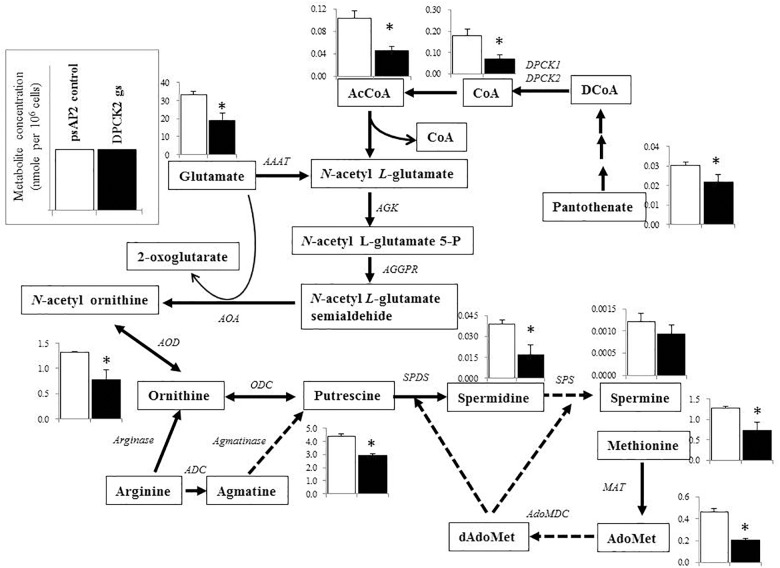
FIGURE 5.
Metabolic profiles of amino acids, polyamines, and associated metabolites affected by Ehdpck2 gene silencing. Broken lines indicate genes whose encoding enzymes known to catalyze the steps are likely absent in the genome. Abbreviations: ND, not detected; CS, citrate synthase; AAAT, amino-acid N-acetyltransferase; AGK, acetylglutamate kinase; AGGPR, N-acetyl-L-glutamyl-phosphate reductase; AOA, acetylornithine aminotransferase; AOD, acetylornithine deacetylase; ODC, ornithine decarboxylase; ADC, arginine decarboxylase; MAT, methionine adenosyltransferase, AdoMet, S-adenosyl-L-methionine; dAdoMet, S-adenosylmethioninamine; MAO, monoamine oxidase; AdoMDC, S-adenosylmethionine decarboxylase; SPDS, spermidine synthase; SPS, spermine synthase. Short and successive arrows indicated multiple steps in the corresponding pathway. Data are shown in mean ± SE. Statistical comparison is made by Student’s t-test (∗P < 0.05).

