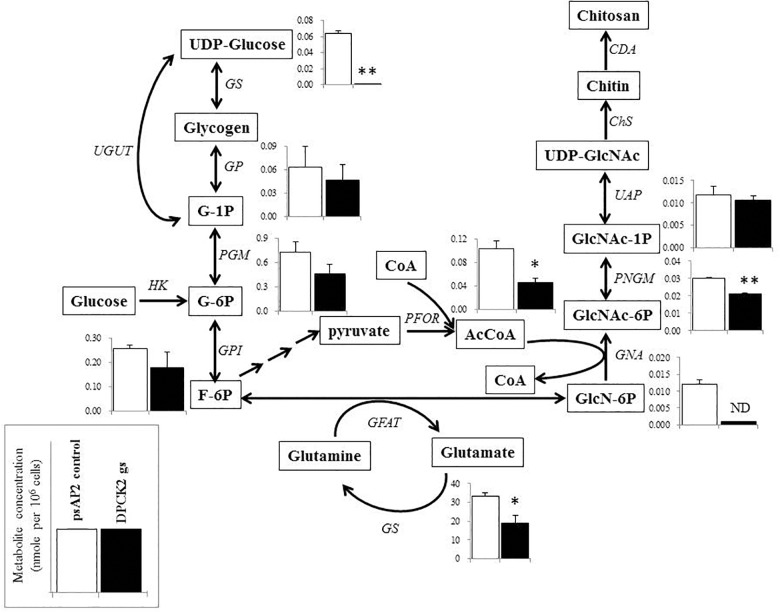
FIGURE 6.
Metabolic profiles of hexose phosphates, glycogen metabolism, chitin biosynthesis, and associated metabolism affected by Ehdpck2 gene silencing. Abbreviations: G-1P, glucose 1-phosphate; G-6P, glucose 6-phosphate; F-6P, fructose 6-phosphate; GlcN-6P, glucosamine 6-phosphate; GlcNAc-6P, N-acetylglucosamine 6-phosphate; GlcNAc-1P, N-acetyl glucosamine 1-phosphate; UDP-GlcNAc, UDP-N-acetylglucosamine; GS, glycogen synthase; GP, glycogen phosphorylase; UGUT, UTP-glucose-1-phosphate uridyltransferase; PGM, phosphoglucomutase; GPI, glucose-6-phosphate isomerase; HK, hexokinase; GFAT, glutamine:fructose-6-phosphate aminotransferase; GS, glutamine synthetase; PFOR, pyruvate ferredoxin oxidoreductase; GNA, glucosamine-phosphate N-acetyltransferase; PNGM, phosphoacetylglucosamine mutase; UAP, UDP-N-acetylgalactosamine diphosphorylase; ChS, chitin synthase; CDA, chitin deacetylase; ND, not detected. Short and successive arrows indicated multiple steps in the corresponding pathway. Data are shown in mean ± SE. Statistical comparison is made by Student’s t-test (∗P < 0.05, ∗∗P < 0.01).

