Figure 2.
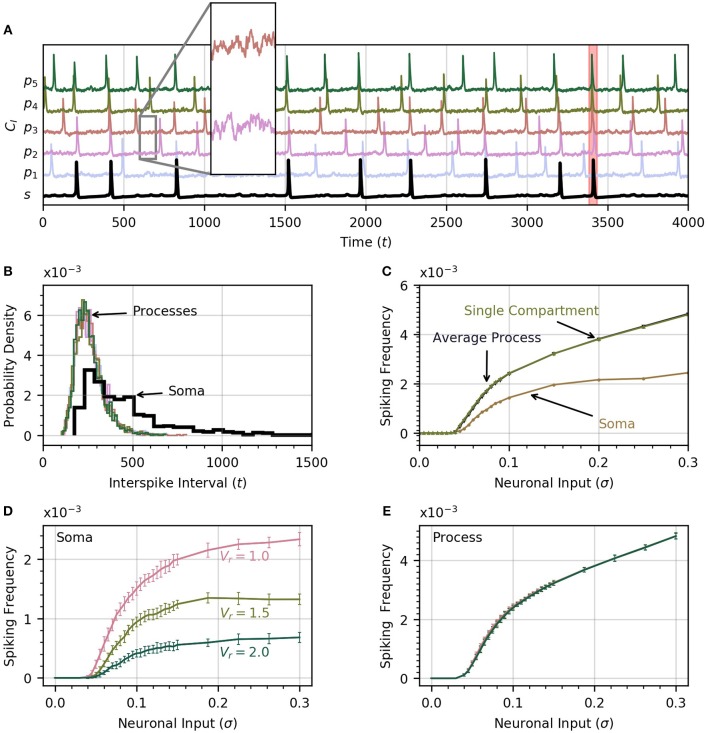
Astrocyte activity under random neuronal input. (A) Time course of cytosolic Ca2+ concentration in five processes (color) and the soma (black, bottom trace) over a 4000 time unit interval. All time traces have been normalized to their maximum value. Subthreshold oscillations are depicted in the inset. The shaded rectangle in the proximity of t = 3500 indicates a global event when at least four of five processes spike within 12.5 time units of the soma spike. (B) Histograms of interspike intervals for all processes and the soma are unimodal and follow an approximate log-normal distribution. (C) Both soma and average process spike frequency increase monotonically with neuronal input intensity. The variation of average process frequency with σ is identical to that for a single compartment model. (D) Spike frequency in the soma depends on the ratio Vr of soma to process volume. As Vr increases, the soma spikes less frequently. (E) On the other hand, spiking rates in the processes depend only very weakly on Vr. When process and soma have equal volume, the process spikes at about half the rate as the soma. In (D,E), error bars were obtained by breaking up a simulation over 106 time units into 20 equal intervals and computing the standard deviation across each interval. The same approach is adoped in subsequent experiments. Note that in our functional model, all units in this and subsequent figures are arbitrary. Simulation parameters: ρ = 0.0, DI = 0.05 and DE = 0 (A–D), Vr = 1 (A–C).

