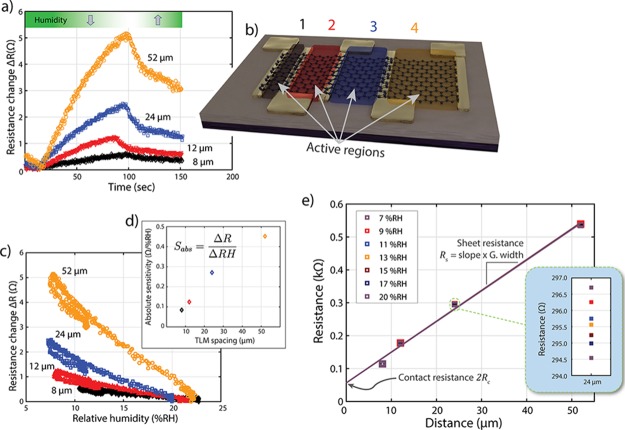
Figure 2.
(a) Change of the device resistance during a measurement cycle. Starting from environmental conditions, dehumidified air was pumped into the chamber for about 100 s. After closing the inlet, ambient humid air diffused into the chamber. The four datasets show the response of graphene patches of different lengths. (b) Schematic illustration of a TLM device. Colorized regions represent graphene areas of varying length contacted by neighboring electrodes. (c) Change in the device resistance as a function of the RH [same datasets as in (a)]. Note the linear dependence. (d) Absolute sensitivity (Sabs) of the measured graphene device at corresponding TLM spacings. (e) TLM plots for evaluation of the contact resistance Rc and the sheet resistance Rs of a single device at various humidity levels. The interception of the linear fit (black line) with the Y-axis yields the contact resistance 2Rc of the two gold–graphene contacts used for probing. The slope of the linear fit and the width of the graphene sheet determine the sheet resistance Rs. Note that the data points and linear fits are nearly indistinguishable. 20% RH: Rc = 28.2 Ω (contact area: 4 × 60 μm2), Rs = 559.9 Ω/square, coefficient of determination R2 = 0.994.

