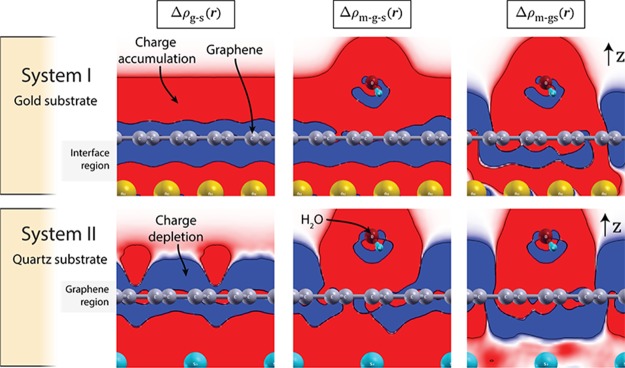
Figure 5.
Two-dimensional contour plots of the CDD in a plane cutting through the water molecule (computed with DFT, see Supporting Information). Top row: Gold/graphene/H2O system. Bottom row: quartz/graphene/H2O system. Red and blue regions represent charge accumulation and depletion, respectively. The isovalue is set to 0.00001 e Å–3. The CDD plots were generated by using XCrySDen visualization program.45 The shaded areas indicate the part of the systems, which is relevant for the contact resistance (interface region) and sheet resistance (graphene region), respectively.

