FIGURE 7.
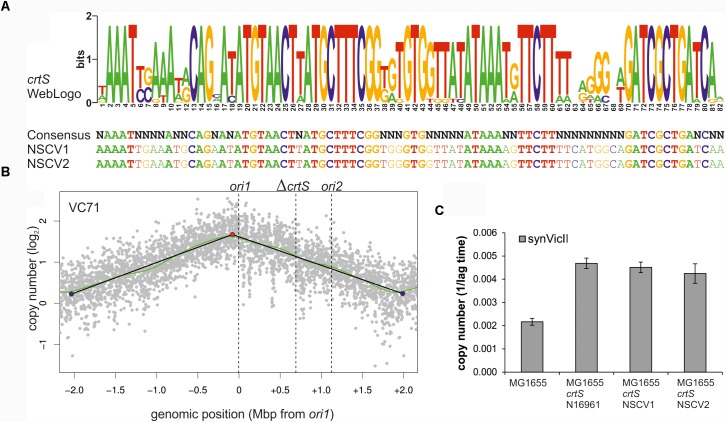
crtS sites of NSCV strains are functional. (A) An alignment of crtS sites from 13 sequenced Vibrio genomes was used to calculate a WebLogo (top panel). The height of the nucleotides in each position represents the measure of conservation. All positions with 100% sequence conservation are conserved in the crtS sequences of NSCV1 and NSCV2 as well (indicated in bold, lower panel) (Kemter et al., 2018). (B) Marker frequency analysis of V. cholerae strain VC71 lacking a functional crtS site. Gray dots represent log numbers of normalized reads as mean values for 1 kbp windows relative to the stationary phase sample. The genome position is shown as the distance from ori1. Vertical dotted black lines mark the locations of replication origins of replication and the crtS sites. The solid black lines represent the fitting of regression lines and the green line corresponds to the Loess regression (F = 0.05). Maxima are highlighted by red and minima as blue dots. Plots of biological replicates are shown in Supplementary Figure S1. (C) crtS sites of NSCV1 and NSCV2 increase the copy number of ori2-based mini-chromosomes in E. coli. E. coli strains harboring the ori2-based mini-chromosome synVicII and chromosomal insertions of crtS from different V. cholerae strains as indicated were grown in LB medium with 500 μg/ml ampicillin in a 96-well plate at 37°C. As strains with a lower replicon copy number have a longer lag period to initiate growth, the value 1 divided by the time to reach an OD600 ≥ 0.1 was used as measure for the replicon copy number. Values are the mean of three biological replicates with indicated standard deviation. Growing the strains in standard concentrations of ampicillin did not show any difference between wild type and crtS carrying strains as expected (data not shown).

