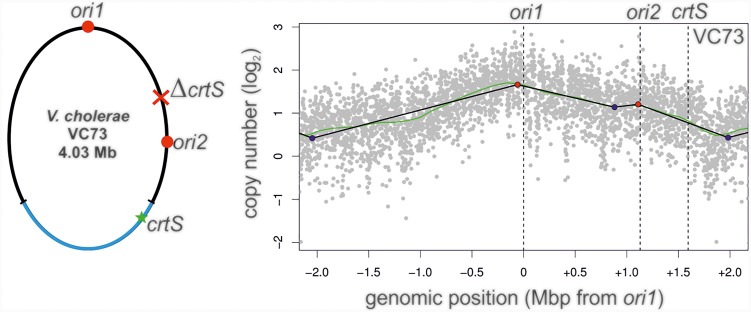
FIGURE 8.
Marker frequency analysis of V. cholerae strain VC73. Left panel: Genomic map of VC73 showing the locations of ori1, ori2, and crtS. Right panel: Profile of genome-wide copy numbers. Gray dots represent log numbers of normalized reads as mean values for 1 kbp windows relative to the stationary phase sample. The genome position is shown as the distance from ori1. Vertical dotted black lines mark the locations of replication origins of replication and the crtS sites. The solid black lines represent the fitting of regression lines and the green line corresponds to the Loess regression (F = 0.05). Maxima are highlighted by red and minima as blue dots. Plots of biological replicates are shown in Supplementary Figure S1.

