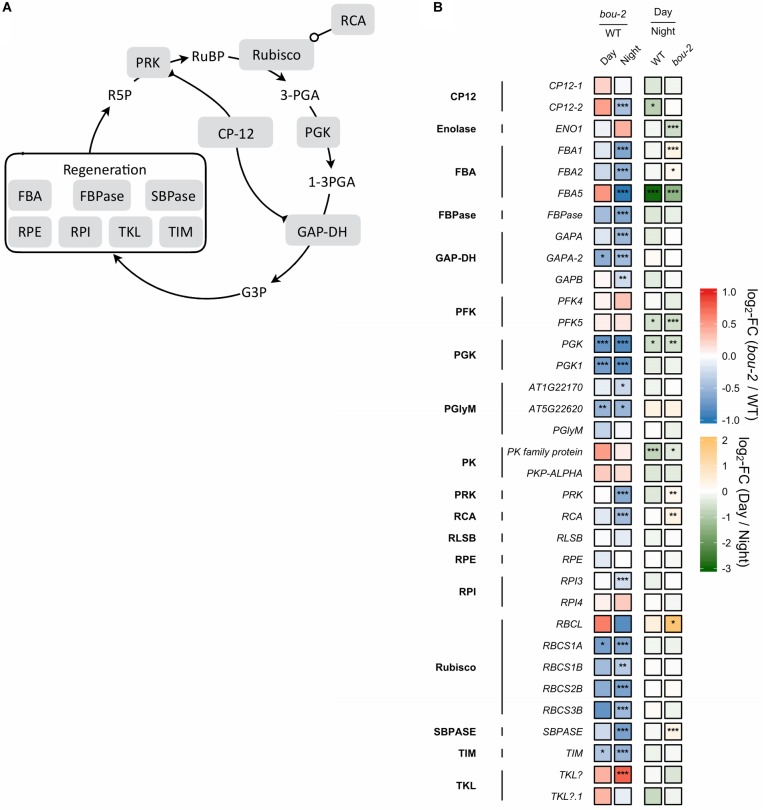
FIGURE 4.
(A) Schematic presentation of the Calvin–Benson–Bassham cycle (CBBC). (B) Transcript levels (n = 3) of genes involved in CBBC. Left two tiles of each gene represent the log2-fold change (FC) between the bou-2 mutant and WT plants under both day (D) and night (N) with false color code ranging from red (higher in bou-2) to blue (higher in WT). Right two tiles represent the log2-fold change (FC) between day and night within WT plants and bou-2 mutant with false color code ranging from green (higher at night) to yellow (higher at day). Asterisks indicate differential gene expression as determined by Sleuth (∗FDR < 0.05, ∗∗FDR < 0.01, and ∗∗∗FDR < 0.001). CP12, CP12 domain-containing protein; FBPase, fructose bisphosphatase; GAP-DH, glyceraldehyde 3-phosphate dehydrogenase; PGK, phosphoglycerate kinase; PRK, phosphoribulokinase; RCA, rubisco activase; RPE, ribulose-phosphate 3-epimerase; RPI, ribose-5-phosphate isomerase; Rubisco, ribulose-bisphosphate carboxylase; SBPASE, sedoheptulose-1,7-bisphosphatase; TKL, transketolase.

