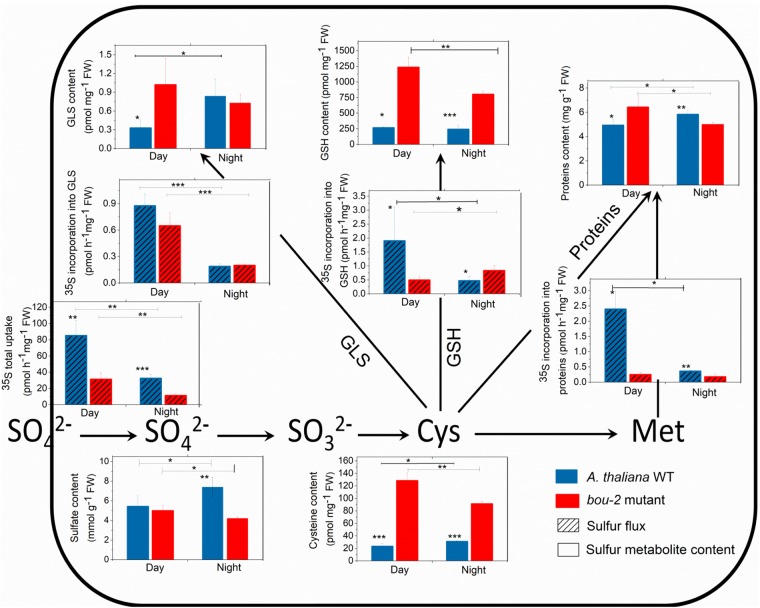
FIGURE 6.
Foliar sulfur metabolite content and sulfur fluxes in the A. thaliana WT and the bou-2 mutant during day and night. Asterisks indicate significant differences as determined by Student’s t-test (∗P < 0.05, ∗∗P < 0.01, and ∗∗∗P < 0.001). All values are means ± standard deviation of 4 replicates.

