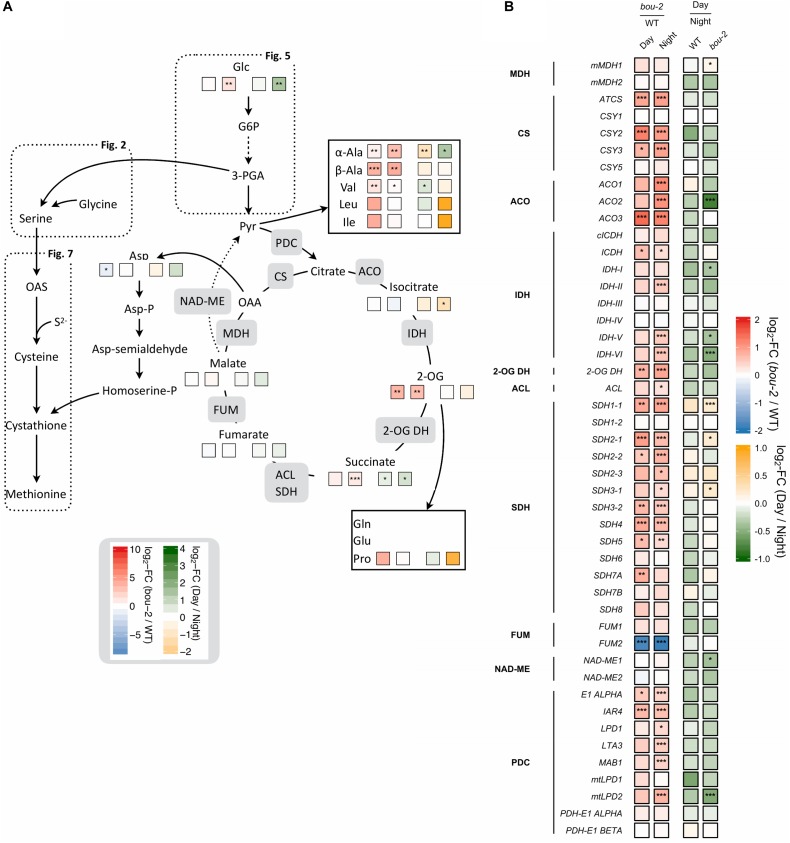
FIGURE 8.
Cross-talk of sulfur with nitrogen assimilation and catabolic carbon metabolism. (A) Schematic presentation of amino acids and other metabolites which closely interact with sulfur metabolism in serine and cysteine biosynthesis analyzed in leaves of the A. thaliana WT and the bou-2 mutant at day and night exposure (n = 4). (B) Transcript levels (n = 3) of genes encoding for enzymes of the tricarboxylic acid (TCA) cycle. Left two tiles represent the log2-fold change (FC) between the bou-2 mutant and the WT plants at both day (D) and night (N) exposure with false color code ranging from red (higher in bou-2) to blue (higher in WT). Right two tiles represent the log2-fold change (FC) between day and night exposure within the WT plants and bou-2 mutant with false color code ranging from green (higher at night) to yellow (higher at day). Asterisks indicate significantly different metabolite levels (A) as determined by Student’s t-test (∗p < 0.05, ∗∗p < 0.01, and ∗∗∗p < 0.00) or differential gene expression (B) as determined by Sleuth (∗FDR < 0.05, ∗∗FDR < 0.01, and ∗∗∗FDR < 0.001). 1, malate dehydrogenase (MDH); 2, citrate synthase (CSY); 3, aconitase (ACO); 4, isocitrate dehydrogenase (IDH); 5, 2-OG dehydrogenase (2OG DH); 6, Succinate-CoA ligase (ACL); 7, succinate dehydrogenase (SDH); 8, fumarase (FUM); 9, NAD-malic enzyme (NAD-ME); 10, pyruvate dehydrogenase.

