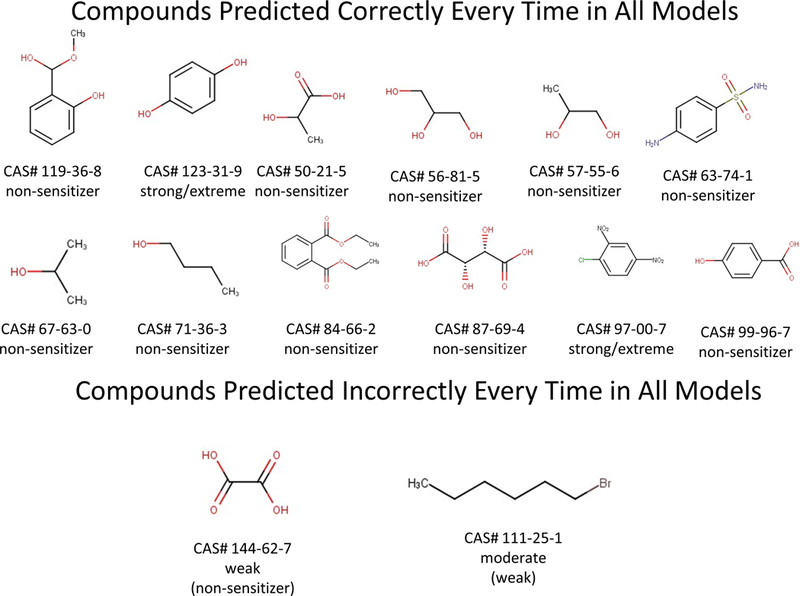
Figure 4.

The 14 chemicals that were predicted correctly during all runs in all three networks as well as the five that were predicted incorrectly every time in all three models. The results of the actual LLNA tests are given below the chemical figure; those predicted incorrectly also include the most common prediction in parentheses.
