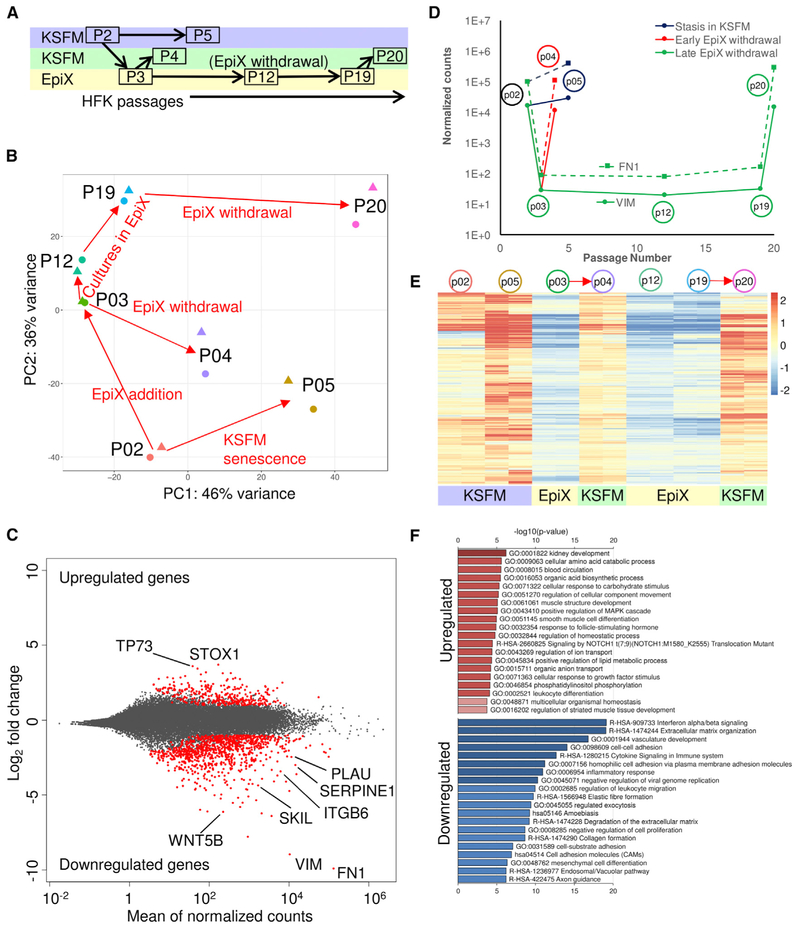
Figure 2. Transcriptome Analysis of HFKs Expanded with the EpiX Medium.
(A) Experimental scheme of HFK expansion in KSFM or the EpiX medium and time points for samples collection. HFKs underwent three different routes: (1)stasis in KSFM (P2→P5); (2) transient exposure and withdrawal from the EpiX medium (P2→P3→P4); and (3) expansion in the EpiX medium and withdrawal at late passage (P3→P12→P19→P20). Each sample was collected in duplicate.
(B) PCA on HFK transcriptomes in various conditions. The red arrows represented the direction of culture condition changes.
(C) MA plot of differentially expressed genes in two different media. The red dots represented differentially expressed genes.
(D) Temporal expression changes of two top downregulated genes, VIM (solid line) and FN1 (dashed line).
(E) Heatmap of 962 downregulated genes in HFKs expanded with the EpiX medium. These downregulated genes were de-repressed when the HFKs were withdrawn from EpiX medium. The red arrows indicated EpiX medium withdrawal.
(F) Gene ontology (GO) and pathway enrichment analysis of upregulated and downregulated genes by metascape tool.

