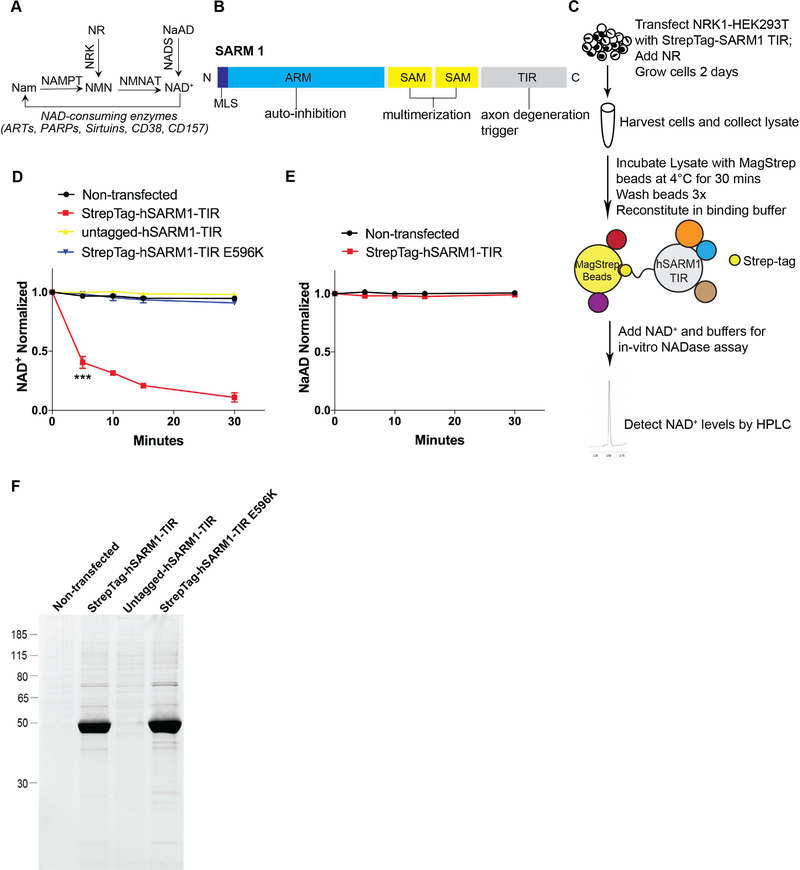
Figure 1: Native SARM1-TIR protein complex cleaves NAD+ in an in vitro assay.
A) Selected pathways of NAD+ synthesis and degradation. Nam–Nicotinamide; NMN–Nicotinamide Mononucleotide; NAD+–Nicotinamide Adenine Dinucleotide; NR–Nicotinamide Riboside; NaAD–Nicotinic Acid Adenine Dinucleotide; NAMPT–Nicotinamide Phosphoribosyltransferase; NRK–Nicotinamide Riboside Kinase; NMNAT–Nicotinamide Mononucleotide Adenylyltransferase; NADS– NAD+ synthetase; ART–ADP Ribosyltransferase; PARP–Poly ADP-Ribose Polymerase. B) SARM1 domains. MLS–Mitochondrial Localization Signal; ARM–Armadillo/HEAT Motifs; SAM–Sterile Alpha Motif; TIR–Toll/Interleukin 1 Receptor. C) Schematic illustrating the in vitro NADase assay.D) NAD+ cleavage reaction timecourse of human SARM1-TIR (wild type and mutant) laden beads in NADase assay (normalized to control at 0 min). E) NaAD reaction timecourse of human SARM1-TIR laden beads in NADase assay (normalized to control at 0 min). F) SYPRO Ruby gel of SARM1-TIR laden beads used in assay. Data for each time point was generated from three independent experiments using purified protein from three independent transfection experiments. Data are presented as mean ± SEM; Error bars: SEM; ***P<0.001 one-way ANOVA. See also Figure S1.

