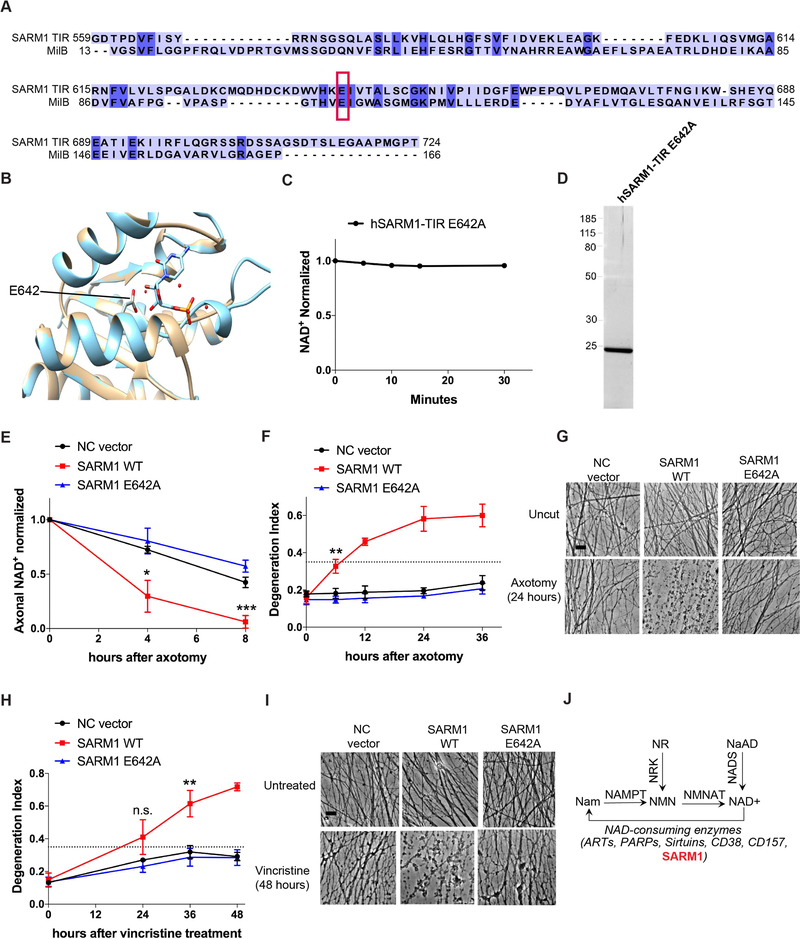
Figure 4: SARM1 enzymatic activity functions in axons to promote pathological axonal degeneration.
A) Amino acid sequence alignment of SARM1-TIR with MilB Cytidine 5’ Monophosphate (CMP) Hydrolase. CMP catalytic glutamic acid is highlighted in red box and aligns to glutamic acid 642 in the SARM1-TIR domain. B) Modeling of the SARM1-TIR domain on the crystal structure of CMP Hydrolase bound to CMP. E642 aligns with a catalytic residue of CMP Hydrolase. C) NAD+ reaction timecourse of human SARM1-TIR E642A purified from cell-free protein translation system (normalized to control at 0 min). D) SYPRO Ruby gel of SARM1-TIR E642A purified from cell-free protein translation system. E) Axonal NAD+ levels after axotomy (normalized to control at 0 hr). NC vector, SARM1 WT, and SARM1 E642A constructs were expressed in SARM1−/− DRG neurons, and levels of NAD+ were obtained at indicated timepoints after axotomy. F) Axonal degeneration timecourse after axotomy, quantified as degeneration index (DI) where a DI of 0.35 (indicated by dotted line) or above represents degenerated axons. G) Bright-field micrographs of axons expressing indicated constructs represented in F. H) Axonal degeneration timecourse after vincristine treatment, quantified as DI. I) Bright-field micrographs of axons after vincristine treatment corresponding to selected groups in H. Scale bar, 5μm. Quantification data were generated from at least three independent biological experiments. Data are presented as mean ± SEM; Error bars: SEM.*P<0.05, **P<0.01, ***P<0.001 one-way ANOVA. J) Selected pathways of NAD+ synthesis and degradation including SARM1 as a NAD+ consuming enzyme. See also Figure S4.

