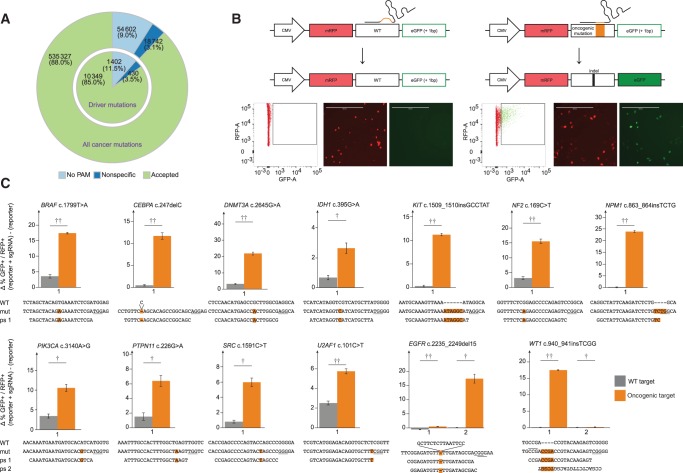
Figure 1.
sgRNA design and evaluation of sgRNA efficacy and selectivity. A) Bioinformatics analysis and sgRNA design for cancer mutations. A pie chart for reported cancer mutations and for cancer driver mutations for Streptococcus pyogenes sgRNAs is shown. B) Overview of “traffic light” reporter assay. Important elements are indicated. Representative examples of fluorescence-activated cell sorting plots and microscopy images are shown (scale bars = 400 µm). C) Activity and selectivity of employed sgRNAs. The targeted mutations are indicated above each graph, with the wild-type, mutant, and protospacer sequences illustrated below each graph. Error bars represent SD from experiments performed in triplicates. Two-sided Student’s t test *P<.05; **P<.01; ***P<.001. mut = mutant; ps = protospacer; WT = wild-type.

