Figure 2.
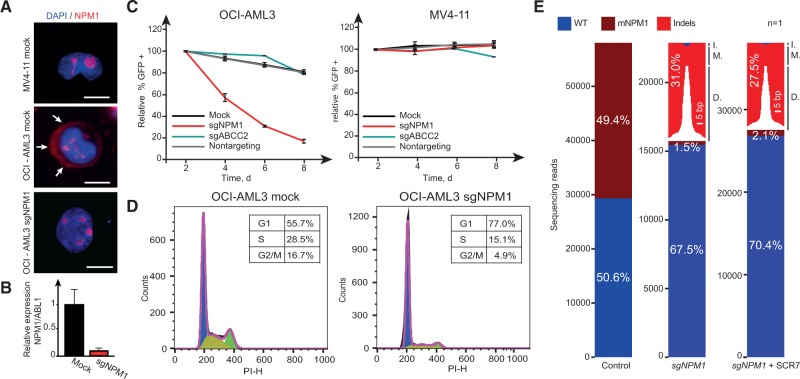
Effects of mutant NPM1 inactivation. A) Localization of NPM1 in MV4-11 and OCI-AML3 cells under indicated treatment conditions (scale bars = 10 µm). Arrows highlight the cytoplasmatic localization of mutant NPM1 in mock-treated OCI-AML3 cells. OCI-AML3 sgNPM1 images were taken 96 hours after sgRNA treatment. B) Relative mRNA expression level of mutated NPM1 after sgRNA treatment. mRNA was extracted 96 hours after sgRNA treatment. C) Relative abundance of cells treated with indicated sgRNAs in MV4-11 and OCI-AML3 over time. Error bars show SD from experiments performed in triplicates. D) Cell-cycle profile of OCI-AML3 cells after indicated treatments. Fluorescence-activated cell sorting analyses were performed eight days after sgRNA treatment. E) Graphical representation of NPM1 sequencing reads under indicated conditions (one biological replicate each). Size of deletions and insertions are indicated in white and black, respectively. sgNPM1–OCI-AML3 cells treated with sgRNA-targeting mutant NPM1 (mNPM1). sgNPM1 + SCR7–OCI-AML3 cells treated with sgRNA-targeting mutant NPM1 in the presence of the ligase IV inhibitor SCR7. Sequencing was performed on genomic DNA isolated eight days after sgRNA treatment. Sixty-four point six percent of the indels resulted in reading frame shifts. D. = deletions; I. = insertions; M. = mutations; WT = wild-type.

