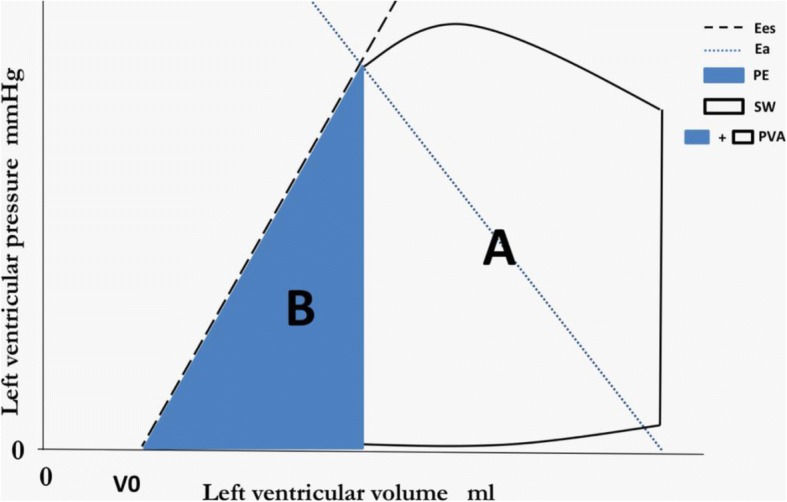
Fig. 1.

Analysis of ventricular-arterial coupling in the pressure-volume plane. A pressure-volume loop is shown along with the end-systolic pressure-volume relationship (black dashed line). The unfilled “A” area represents stroke work; the blue “B” area represents potential energy. EES is the slope of the end-systolic pressure-volume relationship. EA (blue dashed line) is plotted on top of the pressure-volume loop. V0 is the volume-axis intercept of the end-systolic pressure- volume relationship, representing the LV volume at zero intracavitary pressure. The pressure-volume area (PVA) is the sum of potential energy and stroke (i.e., external) work. The PVA represents the total mechanical energy generated by LV contraction until the end of systole
