
Fig. 1.
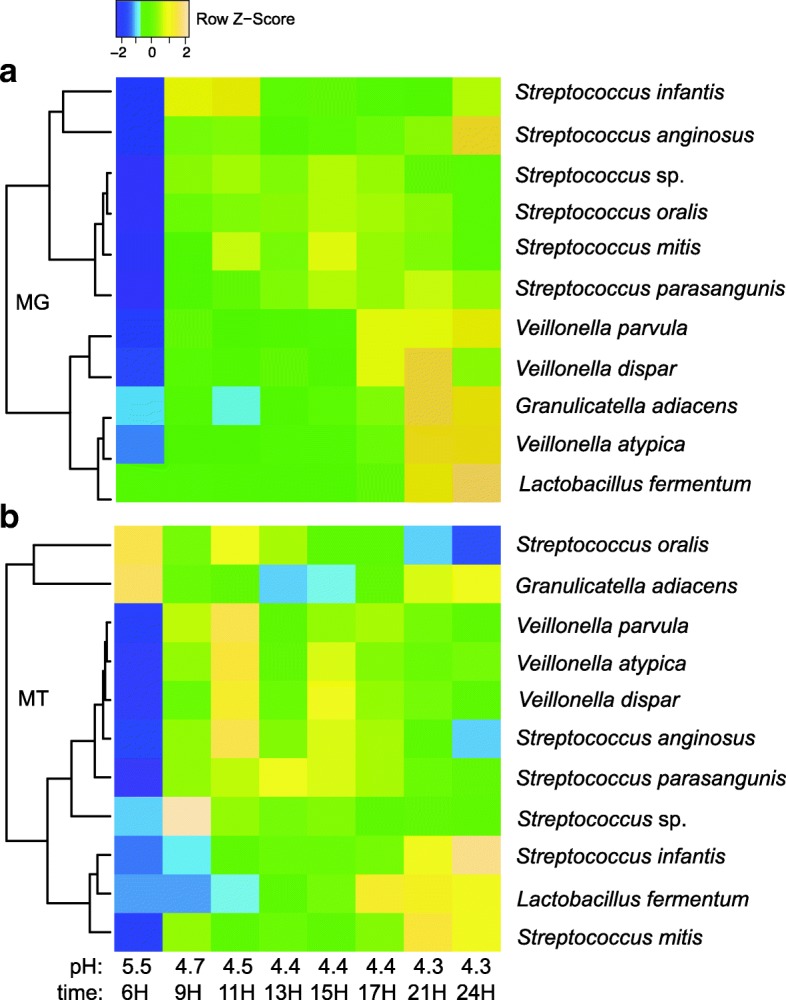
Hierarchical cluster analysis of key bacterial taxa relative abundances in the biofilm community obtained by analyzing DNA (a) and mRNA (b) reads and averaging the biological replicates with the Metagenomic Intra-Species Diversity Analysis System (MIDAS) pipeline. Pearson correlation was used as distance measure. Color gradients correspond to z-score values calculated from normalized abundance values. Taxa were included in bar graph if they contributed with ≥0.5% to the total number of sequence reads at any given time point between 6 h and 24 h of biofilm growth. Detailed bar graphs based on BWA-MEM read mapping results and DESeq and GABE normalization, which also include the biological replicates and less abundant taxa are visualized in Additional file 2: Figure S1