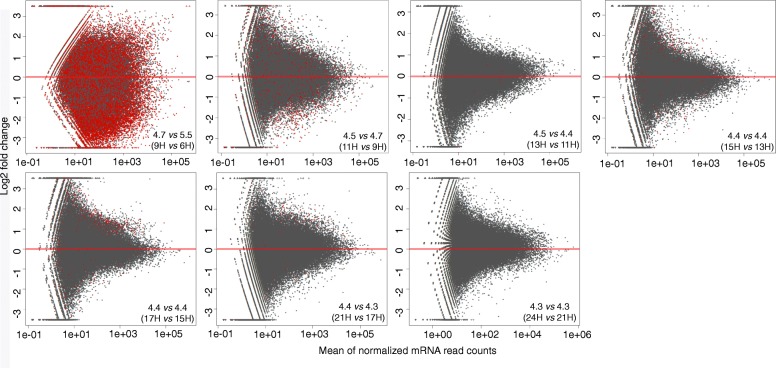
Fig. 2.
MA plots from DESeq analysis showing differences in gene transcription activity between pH stages. Log2 fold changes are presented on y-axes, while means of the normalized read counts are presented on x-axes. Red horizontal lines indicate zero-fold change, and red dots in individual graphs represent all genes independent of fold change cutoffs that changed significantly (fdr corrected p-value < 0.05)

