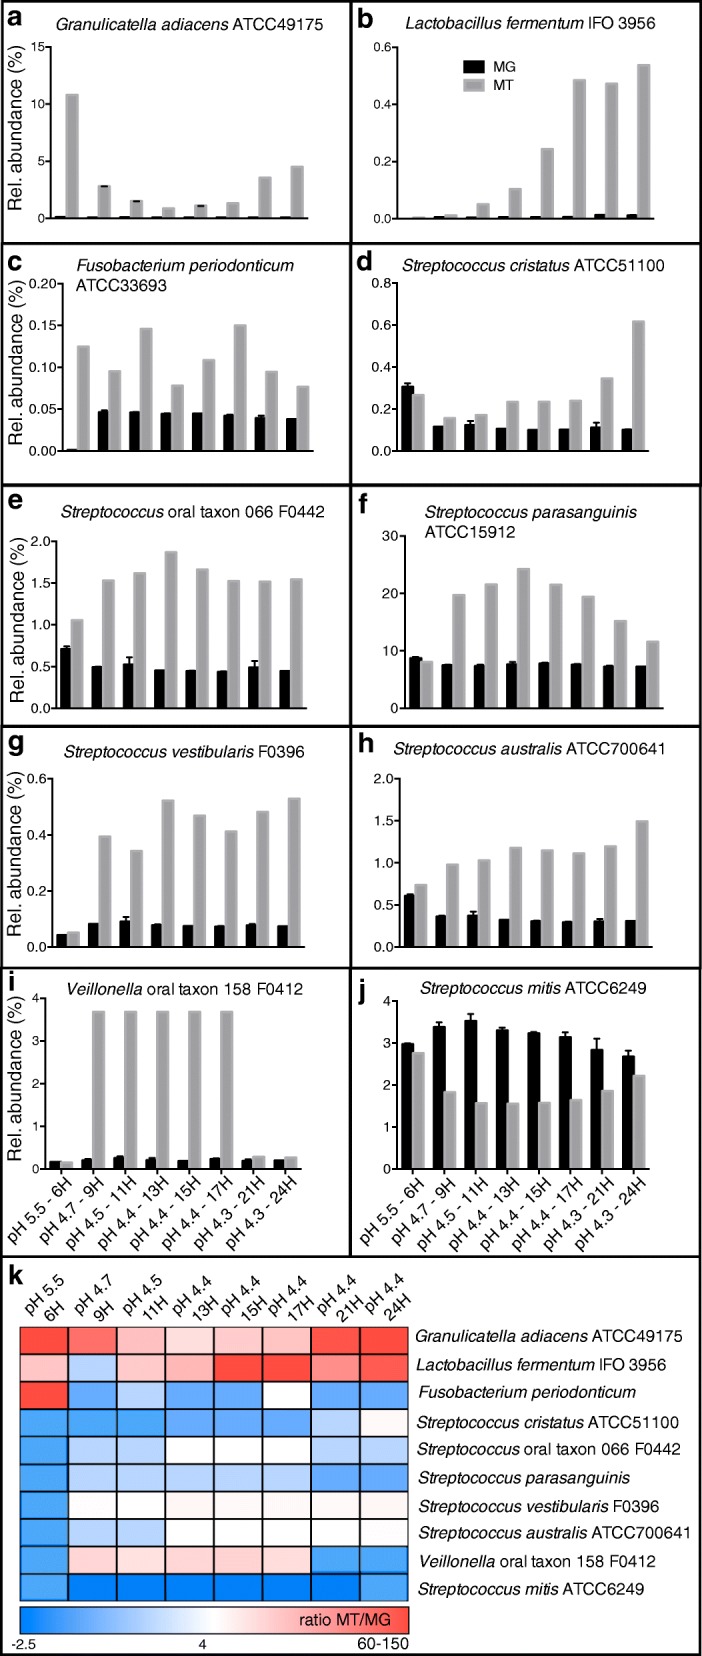
Fig. 3.

Relative abundance estimates from read mapping of bacterial DNA (black bars) and mRNA (gray bars). Ten bacterial genomes (a-j) with the largest differences between mRNA/DNA ratios were included. Panel k show a heat map of mRNA/DNA ratios for each genome across time points and pH stages. Ratios range between 2.5- and 150-fold differences
