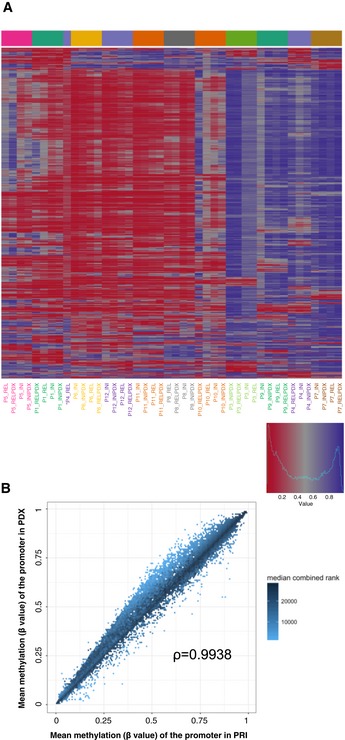
Figure 3. The epigenomic profile reflected by DNA methylation is recapitulated in NSG mice.

-
AUnsupervised hierarchical clustering based on the average degree of methylation of the 500 most variable promoters (red—low/violet—high methylation levels); * relapse (REL) sample of patient P4 with blast content of 8%.
-
BThe degree of the mean promoter methylation in patients’ samples plotted against the degree of mean promoter methylation in PDX samples; ρ—Spearman's rank correlation coefficient; median combined ranks across hexagonal bins are shown as a gradient according to the color legend.
