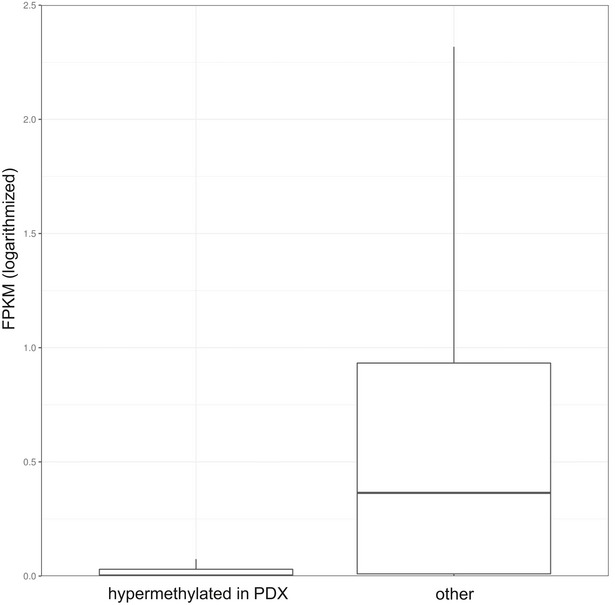
Figure EV3. Majority of hypermethylated genes are transcriptionally silent in T‐ALL.

Boxplot comparing expression values (FPKM) between the genes that were hypermethylated upon propagation in mice (22) and the entire transcriptome in the cohort of 264 publicly available primary patients’ samples (Liu et al, 2017). Horizontal lines indicate median, lower and upper limits of each box correspond to the first and third quartiles (the 25th and 75th percentiles) and the lower and upper whiskers extend from min to max..
