
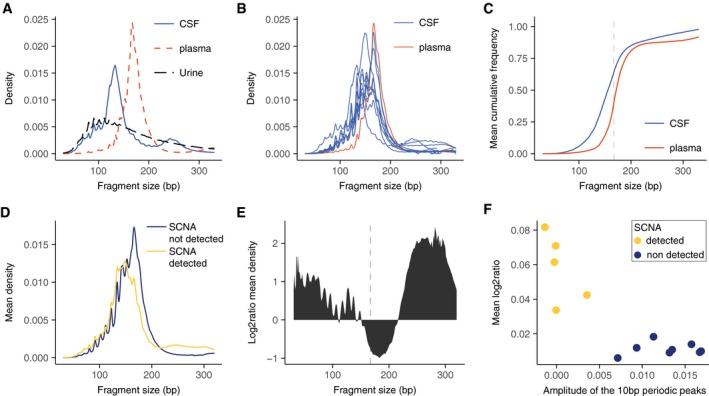
Figure 3. Distribution of DNA fragment sizes in the CSF is related to the presence of tumor DNA .
-
AFragment size distribution, determined by sWGS, in CSF (blue line), plasma (red dashed line), and urine (black dashed line) from patient G1. The three samples were collected simultaneously before initiation of treatment.
-
BFragment size distribution of cfDNA, determined by sWGS, in CSF from 13 glioma patients. The samples contained a high fraction of reads from DNA fragments with lengths corresponding to ˜145 bp and ˜167 bp. The fragment size profile of cfDNA from the plasma sample from patient G1 is shown in red. All samples were collected simultaneously before initiation of treatment.
-
CCumulative frequency analysis of the average density of fragment size in CSF (blue) and plasma (red). The vertical dashed line represents 167 bp.
-
DMean fragment size density in patients with detected SCNAs in the CSF (yellow), and those with no detected SCNAs (dark blue).
-
ELog2 ratio of the difference in cfDNA fragment sizes between CSF samples with detected SCNAs and those samples in which no SCNAs were detected.
-
FThe amplitude of the 10 bp periodic peaks in fragment size is a signature for non‐tumor DNA in the CSF. The amplitude of the 10 bp periodic peaks in fragment length distribution (in the range between 75 and 150 bp, see Materials and Methods) when compared to the mean copy number alteration calculated from sWGS revealed a significant negative correlation (Pearson −0.85; P = 0.0002).