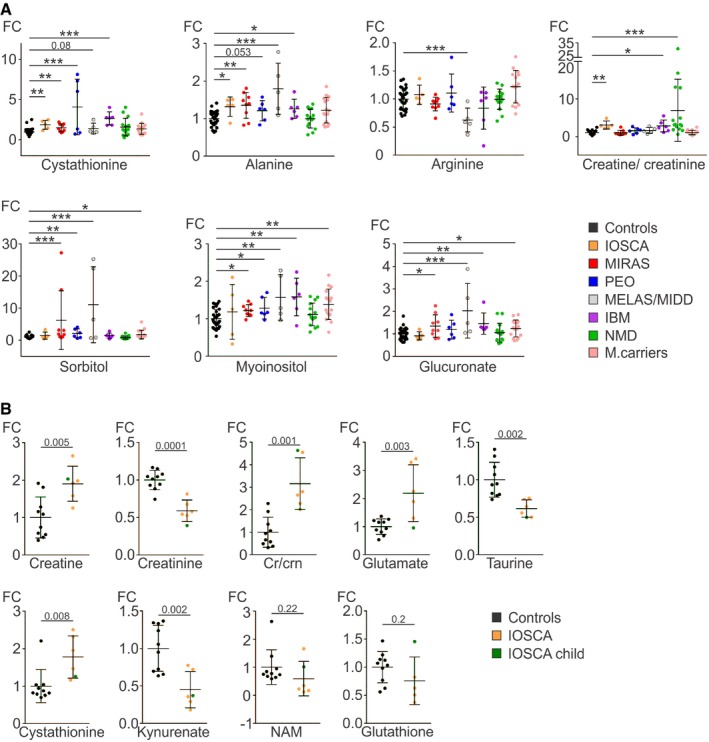
Relative values of single metabolites and creatine/creatinine ratios in blood of primary MD, IBM and NMD patients, and MIRAS carriers compared to controls.
Relative values of single metabolites in blood of adult IOSCA (marked “IOSCA”) patients and one IOSCA child patient compared to controls.
Data information: All data represent mean ± SD. For all individual metabolites: *
P <
0.05, **
P <
0.01, ***
P <
0.001 (two‐sample
t‐test). For creatine/creatinine (cr/crn) ratio: *
P =
0.022, **
P =
0.005, ***
P =
0.0001 (Mann–Whitney test). See
Dataset EV2 for raw data.

