. 2018 Oct 29;10(12):e9091. doi: 10.15252/emmm.201809091

Figure 5. Pathway analysis of blood and muscle metabolites.
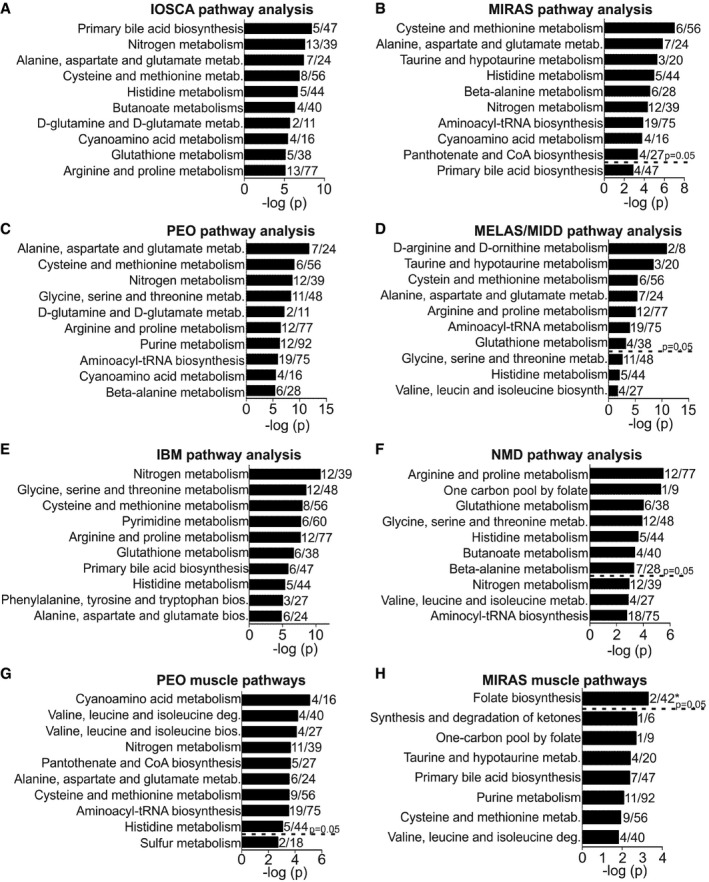
Figure 5

  • A–F
    Changed metabolic pathways in blood of IOSCA (A), MIRAS (B), PEO (C), MELAS/MIDD (D), IBM (E) and NMD (F) patients.
  • G, H
    Changed metabolic pathways in muscle of PEO (G) and MIRAS (H) patients.
Data information: Top 10 pathways with ≥ 10% of detected metabolites per pathway are shown. *5% metabolite coverage in the pathway. bio., biosynthesis; deg., degradation; metab., metabolism. See Dataset EV3 for raw data.