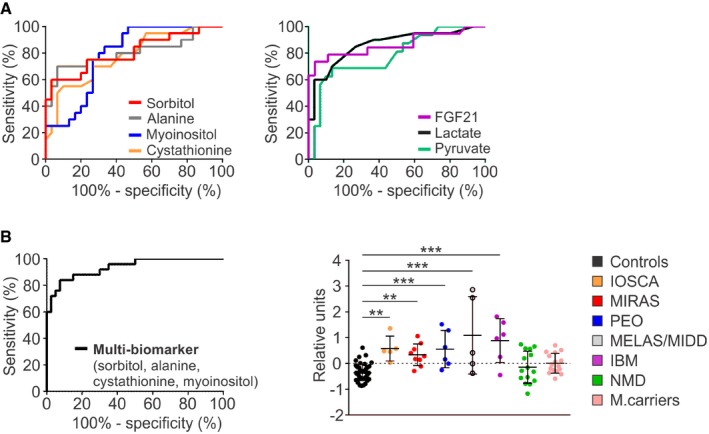
ROC curves for individual metabolites sorbitol, alanine, myoinositol and cystathionine (left) and conventional blood biomarkers lactate and pyruvate, and cytokine FGF21 (right) in blood of MIRAS, PEO and MELAS/MIDD patients (n = 20) compared to controls (n = 30).
ROC curve for the combined “multi‐biomarker” of sorbitol/alanine/myoinositol/cystathionine for primary MDs compared to controls (left); mean centroids for MD, IBM and NMD patients, and MIRAS carriers compared to controls (right).
Data information: ROC analysis: AUC of sorbitol 0.81 (95% CI: 0.68–0.94,
P =
0.0003), alanine 0.81 (95% CI: 0.66–0.94,
P =
0.0003), myoinositol 0.79 (95% CI: 0.66–0.91,
P =
0.0007) and cystathionine 0.78 (95% CI: 0.65–0.91,
P =
0.001); AUC of conventional biomarkers: lactate 0.86 (95% CI: 0.76–0.97,
P =
0.0001) and pyruvate 0.78 (95% CI: 0.64–0.93,
P =
0.0017), and FGF21 0.87 (95% CI: 0.74–0.99,
P =
0.0001). AUC of “multi‐biomarker” 0.94 (95% CI: 0.88–0.995,
P =
0.0001). Mean centroid data represent mean ± SD. **
P <
0.01, ***
P <
0.001 (1‐way ANOVA with Dunnett's multiple comparison test). See
Dataset EV2 for raw data.

