

Abstract
The morphology of the connective tissue may play an important role in locomotor mechanics. Recent research has revealed an association between increased fascia thickness and reduced joint flexibility in patients with chronic pain. The present study aimed to examine the relationship of both factors in healthy individuals, additionally testing the hypothesis that older subjects display a higher fascia thickness. Young (n = 18, 22 ± 1 years) and old (n = 17, 69 ± 4 years) healthy females were recruited for a quasi‐experimental, cross‐sectional trial. All participants underwent standardized ultrasound‐based thickness measurements of the deep fasciae of the trunk and lower limb. Flexibility was assessed using sit and reach testing (hamstring extensibility) and the Schober test (lumbar flexion and extension). Systematic between‐group differences of fascia thickness and variable associations (i.e. fascia thickness and flexibility) were detected using non‐parametric data analyses. Young adults exhibited higher fascia thickness of the anterior and posterior lower leg, anterior thigh and abdominal wall (+12.3–25.8%, P < 0.05). Conversely, older participants showed higher thickness in the lumbar spine (+40.0–76.7%, P < 0.05). Correlations of both body mass and fascia thickness (τ = 0.45–0.75, P < 0.05), as well as flexibility and fascia thickness (τ = 0.38–0.42, P < 0.05) were found. Age‐related changes in fascia thickness may be a contributing factor of restrictions in joint range of motion. Further study delineating the cause–effect triangle of body mass index, flexibility and fascia thickness is necessary.
Keywords: connective tissue, hyaluronic acid, stiffness, myofascial
Introduction
Range of motion (ROM), the maximal distance over which a joint can be moved, represents a significant hallmark of musculoskeletal health, and international guidelines advocate regular exercise to maintain or restore the physiological conditions (Nelson et al. 2007; Paterson et al. 2007; Garber et al. 2011). However, despite the high popularity of corresponding training approaches, the determinants of ROM and their relative contributions have not been fully elucidated. On the one hand, self‐perceived stretch tolerance and associated sensations generated by the central nervous system appear to represent a decisive factor (Weppler & Magnusson, 2010). On the other hand, it has been argued that the flexibility of the soft tissue plays an important role (Nordez et al. 2017).
With reference to the latter, mechanistic point of view, joint flexibility can only be dependent on tissues that cross a joint. Skeletal muscles fulfil this criterion due to their tendinous insertions. As another candidate, the connective tissue, more specifically the deep fascia, can impact ROM in two ways. Firstly, it is densely connected to the underlying muscle along its full peripheral length (Yucesoy, 2010). Changes in the fascia's mechanical properties (e.g. altered stiffness) might therefore restrict muscular extensibility and, with this, ROM. Secondly, fascial tissues have been demonstrated to morphologically link muscles arranged in series (i.e. across a joint; Wilke et al. 2016). Also due to this architectural feature, a stiff fascia can directly limit joint ROM (Fig. 1).
Figure 1.
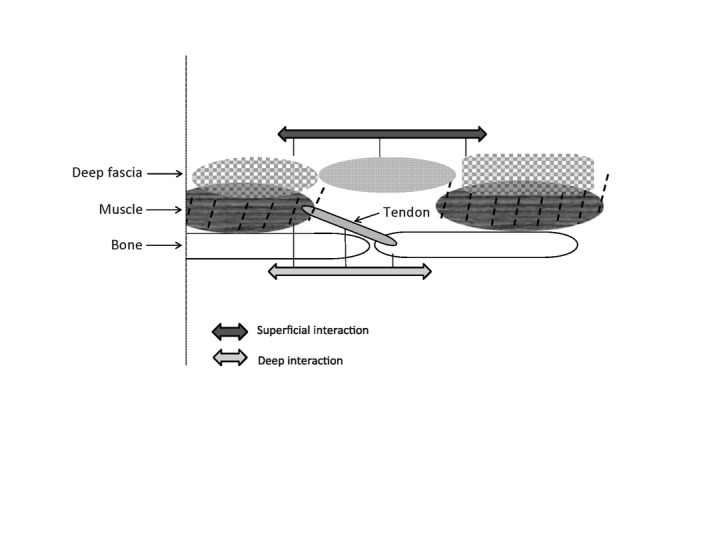
Schematic drawing illustrating mechanical interactions that might restrict joint range of motion (ROM): superficial interactions are based on fibre continuity of two myofasciae, while deep interactions refer to the myotendinous connection between two articulating bones. Note that additional interactions are expected to occur between muscle and fascia.
In addition to other factors (e.g. hydration status and contractile cell activity; Wilke et al. 2018), the tensile stiffness of a tissue is dependent on its cross‐sectional area. A thicker fascia might, therefore, be associated with restricted ROM. Such a relationship has been found in neck patients (Stecco et al. 2014). The present study aimed to investigate the possible association of fascia thickness and flexibility in a healthy population. As decreased flexibility (Bell & Hoshizaki, 1981; Grimston et al. 1993) and increased fascial stiffness (Trindade et al. 2012) have been reported in old individuals, the additional hypothesis was tested that older adults display a higher fascial thickness.
Materials and methods
Ethical standards and study type
A two‐arm cross‐sectional study was performed between January 2016 and September 2016. It was approved by the local ethics committee and conducted in accordance with the Declaration of Helsinki. All participants provided written informed consent prior to study initiation.
Sample
Both young (n = 18) and old (n = 17) healthy adults were recruited (Table 1). Only female participants were included because sex, besides age, represents a systematic predictor of joint flexibility. Exclusion criteria included severe orthopedic, neuronal, psychiatric, cardiopulmonal and endocrine diseases, as well as pregnancy/nursing period.
Table 1.
Age, BMI and ROM of the included participants
| Group 1 (old) | Group 2 (young) | |
|---|---|---|
| N | 17 | 18 |
| Age (years) | 69 ± 4 | 22 ± 1 |
| BMI (kg m−²) | 27 ± 4 | 23 ± 4 |
| Sit and reach (cm) | −4.6 ± 10 | 1.5 ± 11 |
| Schober flexion (cm) | 13.3 ± 1.1 | 14.2 ± 1.1 |
| Schober extension (cm) | 9 (min: 8, max: 10) | 8 (min: 7, max: 9.5) |
Displayed are mean values and standard deviation, respectively, median plus minimum/maximum for Schober extension.BMI, body mass index.
Ultrasound measurements
Using a high‐resolution device (X‐Porte, SonoSite, Bothell, USA) with a frequency range of 6–15 MHz and a screen resolution of 1680 × 1050 pixels, ultrasound images were taken at multiple body parts (lower leg, thigh, thoracolumbar spine, abdominal wall). Connective tissue thickness was then determined by means of the automated software of the device. To eliminate the influence of possible thickness variations, three equidistant points per image were measured and the resulting values were averaged for analysis. The scanner settings were kept constant during the study. All measurements were performed with the participants lying in a standardized, relaxed prone or supine position, respectively.
The thickness of the following tissue structures was determined: anterior and posterior crural fascia, anterior and posterior fascia lata, epimysium of the biceps femoris muscle, rectus sheath, thoracolumbar fascia, erector spinae epimysium, loose connective tissue (LCT) between thoracolumbar fascia and erector spinae epimysium (Fig. 2). All measurements were performed on both body sides; testing order was randomized. For the measurements, the ultrasound transducer was lightly stabilized by hand, taking great care not to compress the tissues at any time during the examination. The anterior fascia lata was measured at the middle of the line that connects the superior anterior iliac spine with the apex of the patella; the anterior crural fascia was evaluated over the tibialis anterior muscle, 10 cm distally to the knee and just lateral to the tibial crest. The posterior fascia lata was measured above the biceps femoris muscle, at the middle of the line connecting the ischial tuberosity with the popliteal fossa, while the posterior crural fascia was measured over the top of the gastrocnemius lateralis muscle. The thoracolumbar fascia was evaluated over the mass of the erector spinae muscles, at the level of L2, 2 cm lateral to the spinous process. Finally, the rectus sheath was evaluated 1 cm laterally and 1 cm distally to the umbilicus. Where possible, distinct measurements for the aponeurotic fascia, epimysial fascia and LCT between the two fascial layers were registered. All measurements were conducted by the same investigator who was highly experienced in the application of musculoskeletal ultrasound, i.e. the evaluation of the connective tissue.
Figure 2.
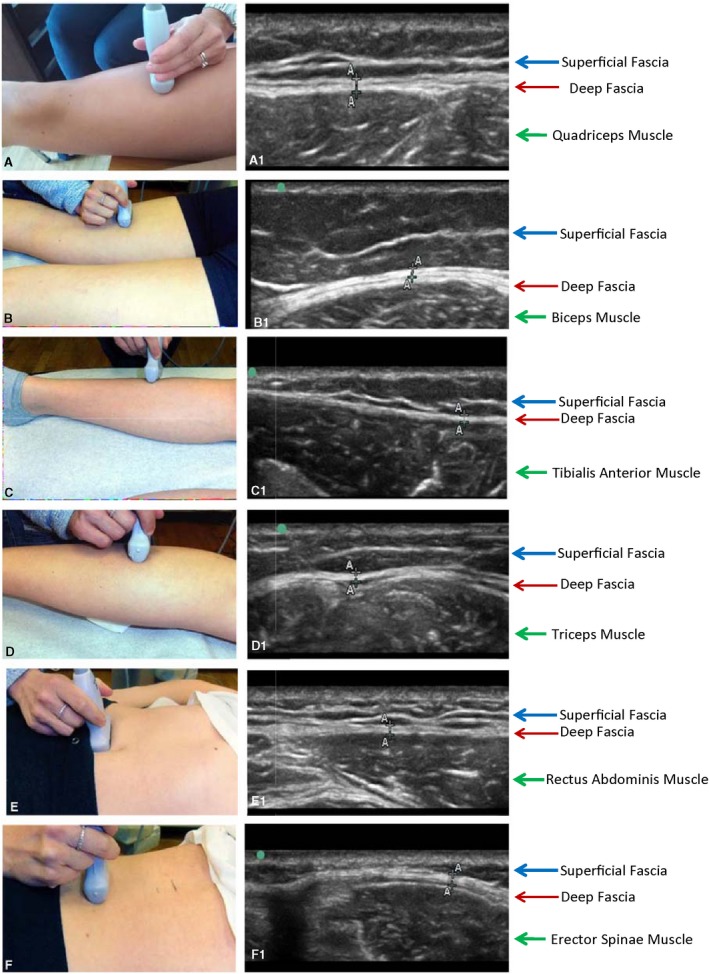
Ultrasound examination of the deep fascia in the various regions of the body. On the left side: position of the probe; on the right side, ultrasound evaluation of the corresponding region. (a) Anterior region of the thigh. (b) Posterior region of the thigh. (c) Anterior region of the leg. (d) Posterior region of the leg. (e) Abdominal region. (f) Lumbar region.
Ultrasound assessments, using the described protocol with three averaged measurements, have been shown to represent a reliable method to determine fascial thickness with regard to both intra‐observer [intraclass correlation coefficient (ICC): 0.67–0.77] agreement and inter‐observer (ICC: 0.82–0.92) agreement (Skovdal Rathleff et al. 2011; Crofts et al. 2014). In fascial tissues, measurement errors of 3–5% have been determined (Bisi‐Balogun et al. 2016).
Flexibility measurements
Immediately after ultrasound imaging, flexibility measurements were conducted. The sit and reach test was used to determine hamstring extensibility. Sitting on the ground with the knees fully extended, the participants were instructed to reach as far forward as possible while pushing the slider of the employed sit and reach box in the anterior direction. Three repetitions were performed. Sufficient reliability and validity of the test have been demonstrated (Ayala et al. 2012; Mayorga‐Vega et al. 2014). Lumbar spine flexibility was measured by means of the Schober test. An investigator marked the spinous process of L5 and a second spot 10 cm cranial to this. The distance between the points served as a reference for the measurements: the participants, from standing in an upright position, performed a full flexion of the lumbar spine and full extension of the spine, respectively. At the end ROM of both movements, the distance between the points was measured again. The test has been shown to be highly repeatable (Gill et al. 1988).
Data processing and statistics
All analyses were performed by an independent investigator. For each measured tissue, the thickness values of both body sides were averaged. Due to non‐normal distribution of the resulting data (Shapiro‐Wilk test), group differences between the old and young participants were investigated with the Mann–Whitney U‐test. In case of significance, effect sizes were calculated using the formula r = z/√n and interpreted as small (0.1–0.3), medium (0.3–0.5) or large (> 0.5; Fritz et al. 2012). To identify systematic associations between the assessed variables, Kendall's tau‐b correlations were used. The significance level for all analyses was set to α = 0.05; the employed software was SPSS 22 (SPSS, Chicago, Illinois USA).
Results
Both groups differed significantly in body mass index (BMI), which was higher in the group of the elderly (P < 0.05, r = 0.55). Younger participants displayed trends towards higher flexibility in lumbar flexion, and sit and reach testing (P < 0.1). In contrast, the older individuals achieved higher values regarding lumbar extension (P < 0.05, r = 0.7). There was no correlation between BMI and flexibility, neither in the total sample nor in the two subgroups (P > 0.05).
Fascia thickness
The deep fascia could easily be identified in all analysed regions, appearing as linear, hyper‐echoic layers. In contrast, it was only possible to evaluate the epimysium of the muscles if a consistent amount of fat or LCT separated it from the deep fascia. This was the case in the posterior region of the thigh and in the lumbar spine. In all other regions, it was impossible to distinguish the fascia from the epimysium.
In four cases (anterior lower leg, posterior lower leg, anterior thigh, abdominal wall), fascial thickness was higher in younger participants (P < 0.05; Table 2). However, in the low back region, an inverse situation was found: thickness of all measured tissue layers (lumbar fascia, lumbar LCT, epimysium of the erector spinae muscle) was higher in older persons (P < 0.05). The observed differences were particularly pronounced in the lumbar fascia (~76%) and lumbar connective tissue (40%). Effect sizes for all group interactions were medium to large (Table 2).
Table 2.
Thickness of different connective tissues in old and young individuals
| Old (mm) | Young (mm) | ∆ (%) | Effect size | |
|---|---|---|---|---|
| Anterior lower leg | 0.65 (0.55–0.90) | 0.8 (0.60–1.1) | 23.1* | 0.43 |
| Posterior lower leg | 0.65 (0.52– 0.90) | 0.73 (0.05–0.1) | 12.3* | 0.39 |
| Anterior thigh | 0.83 (0.57–1.20) | 0.95 (0.6–0.14) | 14.5* | 0.35 |
| Posterior thigh (fascia) | 0.95 (0.72–1.95) | 0.93 (0.75–2.05) | 2.2 | – |
| Posterior thigh (epimysium) | 0.76 (0.40–1.20) | 0.73 (0.25–0.95) | 4.1 | – |
| Posterior thigh (LCT) | 0.4 (0.15–0.93) | 0.35 (0.15–0.65) | 14.3 | – |
| Lumbar fascia | 2.35 (1.45–4.15) | 1.33 (0.75‐3.35) | 76.7* | 0.59 |
| Lumbar fascia (LCT) | 0.77 (0.35–2.85) | 0.55 (0.4–1.50) | 40.0* | 0.42 |
| Epimysium erector spinae | 0.62 (0.47–1.35) | 0.55 (0.4–1.75) | 12.7* | 0.45 |
| Abdominal wall | 0.62 (0.39–1.20) | 0.78 (0.55–1.20) | 25.8* | 0.47 |
Displayed are medians and minimum/maximum values. Asterisks indicate statistical significance (P < 0.05).LCT, loose connective tissue.
Variable associations
In the older participants, thickness of the posterior thigh connective tissue (epimysium: τ = −0.41; LCT: τ = −0.37; P < 0.05) was negatively correlated with sit and reach distance. For the younger group, associations between fascia thickness and flexibility were found in the trunk as abdominal wall thickness correlated negatively with spinal extension (τ = −0.42; P < 0.05; Fig. 3a), and lumbar fascia thickness (τ = 0.38; P < 0.05; Fig. 3b) as well as lumbar LCT thickness (τ = 0.4; P > 0.05; Fig. 3b) were positively associated with spinal flexion. Regarding BMI, systematic positive correlations were found with lumbar fascia thickness in both old and young individuals (τ = 0.45; P < 0.05), as well as with posterior thigh LCT thickness in young participants (τ = 0.75; P < 0.05).
Figure 3.
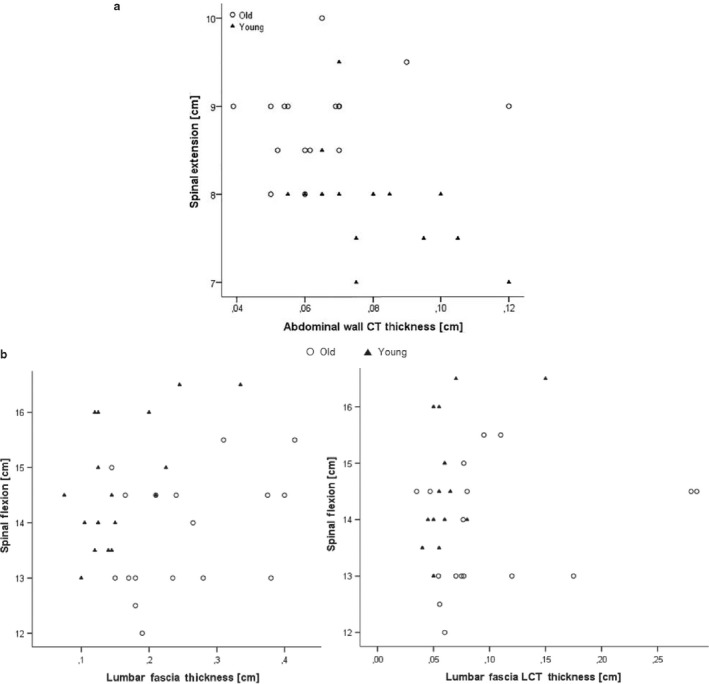
(a) Scatter plot displaying the correlation between spinal extension and abdominal wall connective tissue (CT) thickness in both groups. Note the presence of outliers, particularly in the older participants. (b) Scatter plot displaying the correlation between spinal flexion and lumbar fascia thickness/lumbar fascia loose connective tissue (LCT) thickness in both groups. Note the presence of outliers, particularly in the right plot.
Discussion
To the best of our knowledge, the present study is the first to show that healthy young and old individuals exhibit substantial differences in fascial thickness. The potential relevance of this finding is impressively underlined by the fact that the magnitude of the observed differences at least doubled the measurement error (3–5%) of US‐based thickness measurements.
In the lower limb and the ventral trunk of younger participants, more connective tissue envelops the skeletal muscles. A possible reason for this consists in the presumably higher muscle mass of this group. However, interestingly, an opposite pattern exists in the low back region: the connective tissue is considerably thicker in the elderly, which could be the result of increased body mass. This theory is supported by the finding of a higher BMI in the group of older participants, and the general correlation between BMI and connective tissue thickness in the lumbar region.
A higher fascial cross‐sectional area in the low back region might help to counteract gravity, as its center is located ventral to the spine and increased abdominal volume creates a longer lever arm. Combining both findings, increased fascial thickness in the lumbar spine of old persons and increased fascial thickness in the legs of young persons, it could be argued that the connective tissue dynamically adapts to the forces acting upon it: higher muscle strength and higher body weight require a thicker connective tissue, which is able to withstand and transmit greater forces. This would be in line with data suggesting a mechanical impact of fascia on musculoskeletal dynamics (Schleip et al. 2005).
Despite the conceivable association of fascial thickness with muscle strength and body mass, other factors, for example, the level and type of physical activity or previous musculoskeletal disorders, appear to play a role. This assumption is backed by two facts. Firstly, according to published data, the typical age‐related decline in skeletal muscle mass is not more pronounced in the trunk when compared with the limbs (Abe et al. 2014) and, therefore, the higher fascial thickness in the back of older participants cannot be explained entirely by a slower muscle loss. Secondly, the association of BMI and fascial thickness existed only for the lumbar fascia and the posterior thigh fascia (the latter in young persons). No correlation between BMI and the lumbar fascia LCT or the perimysium of the erector spinae muscle was found, although the thickness of the latter two was increased in the elderly. It, therefore, can be concluded that at least a part of the thickened lumbar tissues in older adults is not predicted by body mass.
With regard to the relationship of fascial thickness and joint flexibility, findings were ambivalent, showing both positive and negative associations. In the group of young participants, a negative correlation between fascial thickness of the abdominal wall and spinal extension was found: flexibility decreased in participants with larger amounts of connective tissue. As high tissue thickness implies larger stiffness, the flexibility deficit might have been caused by a thickened fascia. Also in the older participants, restrictions in flexibility were linked to fascial thickness. Large cross‐sectional areas of: (i) the epimysium; and (ii) the LCT inside the deep fascia of the biceps femoris muscle were correlated with poor sit and reach performance. Again, the higher stiffness of the tissue might have driven the observed flexibility decreases. Notwithstanding, the role of the LCT could reach beyond that: separating the different fascial layers, it has been shown to contain high concentrations of hyaluronic acid, which basically functions as a lubricant (Stecco et al. 2011). However, in the absence of mechanical loading (e.g. in less active persons like the elderly), the substance becomes more viscous and the gliding of the fascial layers is restricted (Cowman et al. 2015). It might hence be hypothesized that, due to high concentrations of sticky hyaluronan, the increased LCT thickness of old persons leads to decreased flexibility.
The association of higher fascial thickness and impaired flexibility was not found for the lumbar region. On the contrary, in the group of young participants, high thickness of the lumbar fascia and the lumbar fascia LCT correlated with better values in the Schober flexion test. Possibly, the positive association of LCT thickness in the back and flexibility might again be explained by the hyaluronic acid: due to its thixotropic behavior, mechanical loading – as opposed to immobility – decreases the viscosity of the fluid (Pavan et al. 2014). Consequently, in the case of increased physical activity (as often occurring in younger persons), a higher LCT thickness with high amounts of fluid hyaluronan facilitates the gliding of the fascial layers and, in the end, promotes flexibility. Our data, in conclusion, suggest that increased thickness of the LCT can both restrict (in the case of immobility, e.g. decreased sit and reach performance due to sticky hyaluronan) and enhance (in the case of regular activity, e.g. increased lumbar flexion due to fluid hyaluronan) ROM.
Our study has relevant clinical implications. Based on the collected data, it can be assumed that, in addition to the frequently examined skeletal muscles, also other tissues substantially influence joint flexibility. Physicians and therapists may therefore consider implementing a fascia thickness screening in their clinical routines. Evaluations of fascia thickness can be performed quickly and easily if the investigator is experienced and if a high‐resolution ultrasound device is available. In sum, fascia thickness may become a valuable outcome parameter in the prevention and treatment of musculoskeletal disorders, such as neck or back pain, but this topic warrants further investigation.
Despite our intriguing findings, additional research better elucidating the cause–effect triangle of body mass, ROM and connective tissue thickness is needed. In future trials, the influence of BMI, in particular, should be controlled using a matched‐pairs design or, even better, a stepwise regression model involving the BMI as a covariate. Regarding other variables potentially affecting fascial thickness, it would be prudent to assess muscle volume and the degree of physical activity in order to estimate their significance. Finally, one potential limitation has to be discussed. To evaluate joint flexibility, clinical tests like the sit and reach test, and the Schober test were performed. While they represent realistic methods used in daily practice, more complex, ultrasound‐based or optoelectronic assessments may have provided slightly more precise results. For instance, the used sit and reach test represents a measure of hamstring extensibility. However, it is also marginally influenced by lumbar extensibility (Mayorga‐Vega et al. 2014).
Conclusion
The present trial provides the first evidence indicating that fascia thickness differs substantially between older and younger individuals exhibiting regional specializations: while young persons have a thicker connective tissue in the lower limb, elderly individuals display a higher fascial thickness in the low back region. Our results also suggest a possible influence of fascial cross‐sectional area on joint flexibility, which might be explained by both tissue stiffness and fluid characteristics. Future research should continue to investigate the complex interdependence of fascial thickness, age and flexibility, while controlling for body mass.
Conflict of interests
The authors state that there are no conflicts of interest.
Author contributions
JW: concept/design, data analysis/interpretation, drafting of the manuscript, critical revision of the manuscript, approval of the article. VM: concept/design, data analysis/interpretation, critical revision of the manuscript, approval of the article. RdC: concept/design, data analysis/interpretation, critical revision of the manuscript, approval of the article. CS: concept/design, acquisition of data, data analysis/interpretation, critical revision of the manuscript and approval of the article.
References
- Abe T, Loenneke JP, Thiebaud RS, et al. (2014) Age‐related site‐specific muscle wasting of upper and lower extremities and trunk in Japanese men and women. Age 36, 813–821. [DOI] [PMC free article] [PubMed] [Google Scholar]
- Ayala F, Sainz de Baranda P, de Ste Croix M, et al. (2012) Reproducibility and criterion‐related validity of the sit and reach test and toe touch test for estimating hamstring flexibility in recreationally active young adults. Phys Ther Sport 13, 219–226. [DOI] [PubMed] [Google Scholar]
- Bell RD, Hoshizaki TB (1981) Relationships of age and sex with range of motion of seventeen joint actions in humans. Can J Appl Sport Sci 6, 202–206. [PubMed] [Google Scholar]
- Bisi‐Balogun A, Cassel M, Mayer F (2016) Reliability of various measurement stations for determining plantar fascia thickness and echogenicity. Diagnostics 6, 15. [DOI] [PMC free article] [PubMed] [Google Scholar]
- Cowman MK, Schmidt TA, Raghavan P, et al. (2015) Viscoelastic properties of hyaluronan in physiological conditions. F1000Res 4, 622. [DOI] [PMC free article] [PubMed] [Google Scholar]
- Crofts G, Angin S, Mickle K, et al. (2014) Reliability of ultrasound for measurement of selected foot structures. Gait Posture 39, 35–39. [DOI] [PubMed] [Google Scholar]
- Fritz CO, Morris PE, Richler JJ (2012) Effect size estimates: current use, calculations, and interpretation. J Exp Psychol 141, 2–18. [DOI] [PubMed] [Google Scholar]
- Garber CE, Blissmer B, Deschenes MR, et al. (2011) Quantity and quality of exercise for developing and maintaining cardiorespiratory, musculoskeletal, and neuromotor fitness in apparently healthy adults. Med Sci Sports Exerc 43, 1334–1359. [DOI] [PubMed] [Google Scholar]
- Gill K, Krag MH, Haugh LD (1988) Repeatability of four clinical methods for assessments of lumbar spinal motion. Spine 13, 50–53. [DOI] [PubMed] [Google Scholar]
- Grimston SK, Nigg BM, Hanley DA, et al. (1993) Differences in ankle joint complex range of motion as a function of age. Foot Ankle 14, 215–222. [DOI] [PubMed] [Google Scholar]
- Mayorga‐Vega D, Merino‐Marban R, Viciana J (2014) Criterion‐related validity of sit‐and‐reach tests for estimating hamstring and lumbar extensibility: a meta‐analysis. J Sports Sci Med 13, 1–14. [PMC free article] [PubMed] [Google Scholar]
- Nelson ME, Rejeski WJ, Blair SN, et al. (2007) Physical activity and public health in older adults: recommendation from the American College of Sports Medicine and the American Heart Association. Circulation 116, 1094–1105. [DOI] [PubMed] [Google Scholar]
- Nordez A, Gross R, Andrade R, et al. (2017) Non‐muscular structures can limit the maximal joint range of motion during stretching. Sports Med 9, CD007455. [DOI] [PubMed] [Google Scholar]
- Paterson DH, Jones GR, Rice CL (2007) Ageing and physical activity: evidence to develop exercise recommendations for older adults. Can J Public Health 98(Suppl 2), S69–S108. [PubMed] [Google Scholar]
- Pavan PG, Stecco A, Stern R, et al. (2014) Painful connections: densification versus fibrosis of fascia. Curr Pain Headache Rep 18, 441. [DOI] [PubMed] [Google Scholar]
- Schleip R, Klingler W, Lehmann‐Horn F (2005) Active fascial contractility: fascia may be able to contract in a smooth muscle‐like manner and thereby influence musculoskeletal dynamics. Med Hypotheses 65, 273–277. [DOI] [PubMed] [Google Scholar]
- Skovdal Rathleff M, Moelgaard C, Lykkegaard Olesen J (2011) Intra‐ and interobserver reliability of quantitative ultrasound measurement of the plantar fascia. J Clin Ultrasound 39, 128–134. [DOI] [PubMed] [Google Scholar]
- Stecco C, Stern R, Porzionato A, et al. (2011) Hyaluronan within fascia in the etiology of myofascial pain. Surg Radiol Anat 33, 891–896. [DOI] [PubMed] [Google Scholar]
- Stecco A, Meneghini A, Stern R, et al. (2014) Ultrasonography in myofascial neck pain: randomized clinical trial for diagnosis and follow‐up. Surg Radiol Anat 36, 243–253. [DOI] [PubMed] [Google Scholar]
- Trindade V, Martins P, Santos S, et al. (2012) Experimental study of the influence of senescence in the biomechanical properties of the temporal tendon and deep temporal fascia based on uniaxial tension tests. J Biomech 45, 199–201. [DOI] [PubMed] [Google Scholar]
- Weppler CH, Magnusson SP (2010) Increasing muscle extensibility: a matter of increasing length or modifying sensation? Phys Ther 90, 438–449. [DOI] [PubMed] [Google Scholar]
- Wilke J, Krause F, Vogt L, et al. (2016) What is evidence‐based about myofascial chains: a systematic review. Arch Phys Med Rehabil 97, 454–461. [DOI] [PubMed] [Google Scholar]
- Wilke J, Schleip R, Yucesoy CA, Banzer W (2018) Not merely a protective packing organ? A review of fascia and its force transmission capacity. J Appl Physiol 124, 234–244. [DOI] [PubMed] [Google Scholar]
- Yucesoy CA (2010) Epimuscular myofascial force transmission implies novel principles for muscular mechanics. Exerc Sport Sci Rev 38, 128–134. [DOI] [PubMed] [Google Scholar]