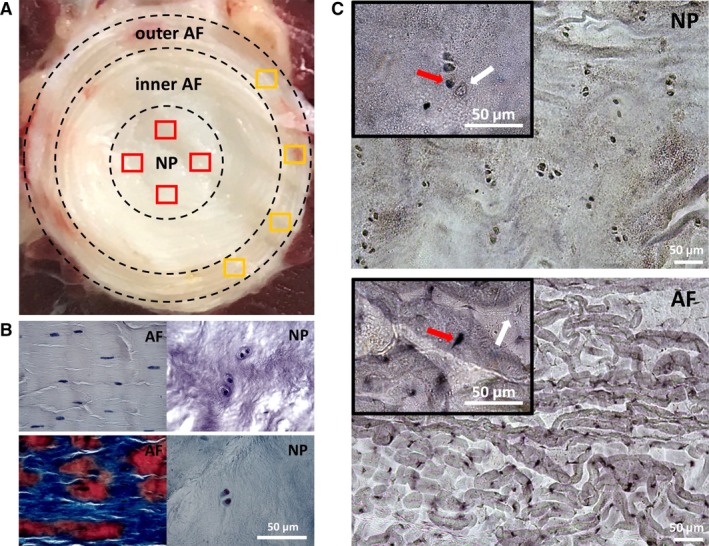
Figure 1.

Illustration of the principle of data collection (a) indicating the random selection of 20 non‐overlapping fields in the outer AF area (oAF) as indicated by four examples of yellow frames and the NP area as indicated by four examples of red frames on a mature bovine coccygeal IVD. Haematoxylin staining (b, top) and Mallory's tetrachrome staining (b, bottom) was performed to identify cells and tissue types. (c) AP‐RISH identification of cells transcribing (red arrow) or not transcribing (white arrow) a particular genetic locus, as shown here for the example of Col1a1 expression, can be observed within the same tissue on a section. Images are shown at 10× and 40× (insert) magnification. Scale bar: 50 μm.
