
Figure 2.
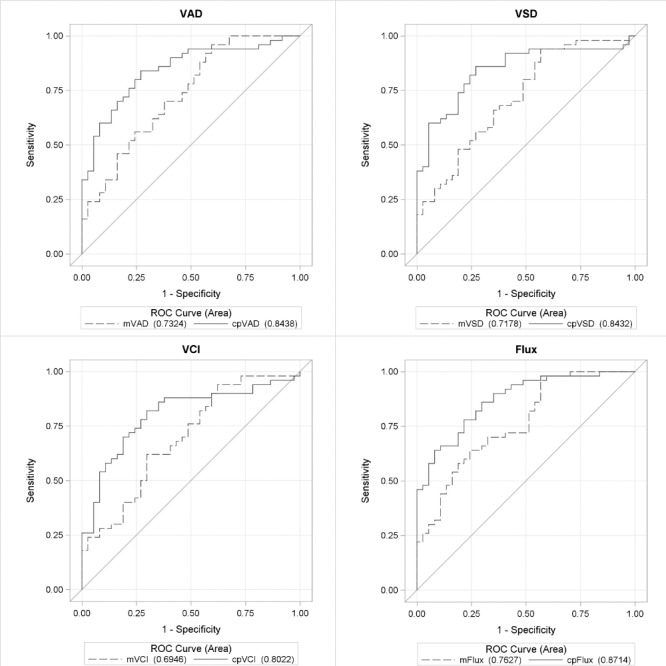
ROC curves for OCTA parameters between POAG and healthy eyes. ROC curves for global VAD, VSD, VCI, and flux for macular (m) and peripapillary (cp) regions for differentiating between healthy and glaucoma eyes, controlling for age and intereye correlation.