
Figure 4.

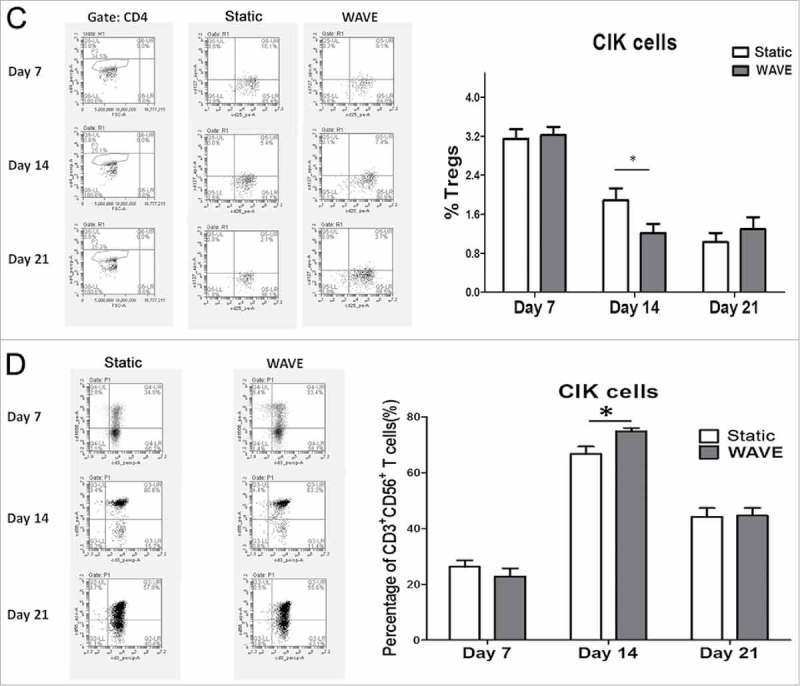
The constitutions of CIK cells. The proportions of CIK cells in different groups were detected by flow cytometry on day 7, day 14 and day 21. The expression of CD4+T cells(A), CD8+T cells(B), Tregs(C) and CD3+CD56+T cells(D) were shown in the figure. The representative flow chart of different group were shown in the left column and the statistical results were shown in the right column. (*,p < 0.05).
Figure 4.
(Continued)