Figure 4.

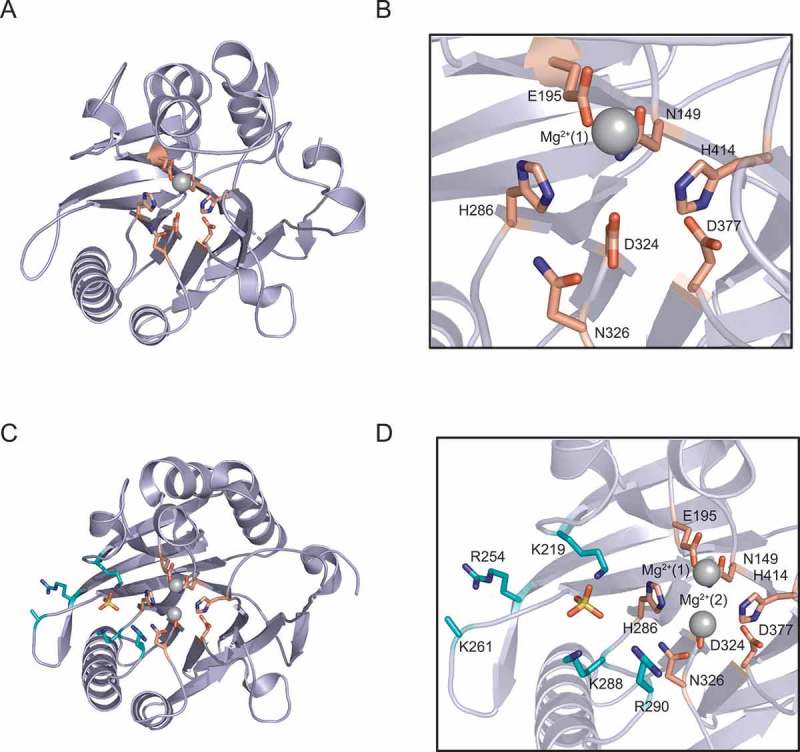
The structure of the hNOCT EEP catalytic domain (aa 120–431) reveals a conserved hydrolase fold. A) Overview of the 1.48 Å resolution structure (6BT1) [71]. Active site residues are shown; one Mg2+ ion (gray) is coordinated to E195 and ordered water molecules (not pictured). B) Magnified view of active site from (A). C) Overview of 2.48 Å resolution structure (6BT2) [71] with active site (salmon) and basic patch (cyan) residues shown. Two Mg2+ ions (gray), coordinated to E195 and D324, and one SO4 2–ion (yellow) bound to lysine side chains adjacent to the active site are shown. D) Magnified view of active site and adjacent basic patch shown in (C).
