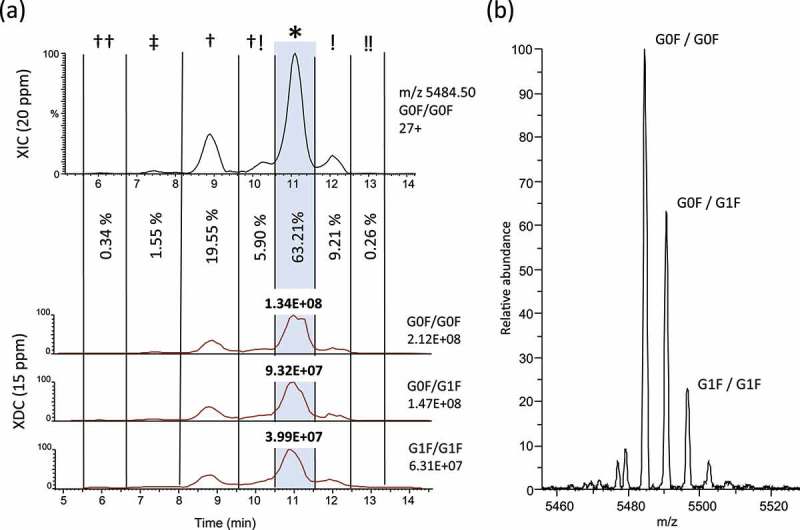
Figure 4.

Isoform-specific measurements of deamidation and isomerization. (a) In order to measure the relative abundance of total amounts of asparagine deamidation and aspartic acid isomerization we plotted an extracted ion chromatogram (XIC) of 20 ppm for the most abundant charge state of G0F/G0F (27+, m/z = 5484.50). Partial peak areas were determined manually and the G0F/G0F isoform at the main peak was measured to be 63.21% of the total abundance. An adjusted XDC area was calculated by multiplying the main peak fraction (*) by the XDC total area under the curve for the top 3 glycoforms. (b) Raw MS spectrum averaged across the main peak shows 27+ charge state with top 3 glycoforms labeled.
