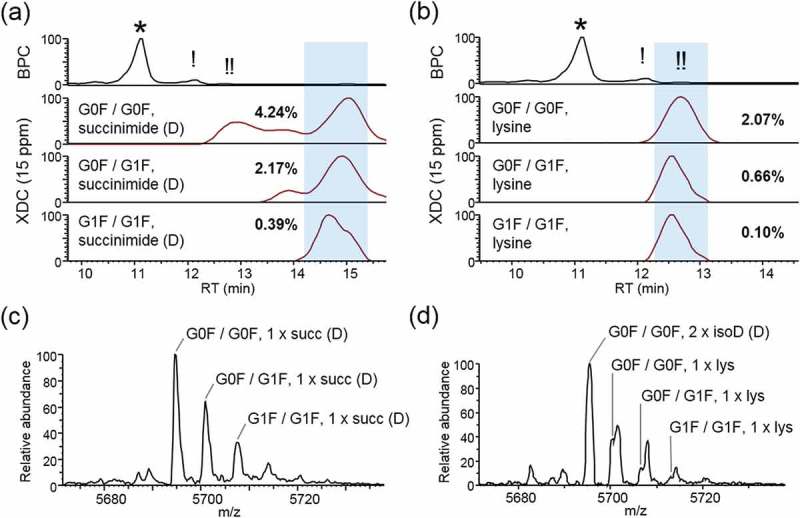
Figure 5.

Basic low-abundance isoforms. (a) Chromatographs showing the base peak (BPC) trace aligned with XDC traces (deconvolved with a mass tolerance set to 15 ppm) of the top 3 glycoforms with one asparagine conversion to succinimide or (b) one un-clipped C-terminal lysine. Abundance of each isoform is shown as a percentage relative to main-fraction adjusted XDC peak area of G0F/G0F. Panels (c) and (d) show mass spectrum averaged across highlighted RT window, for succinimide and lysine, respectively.
