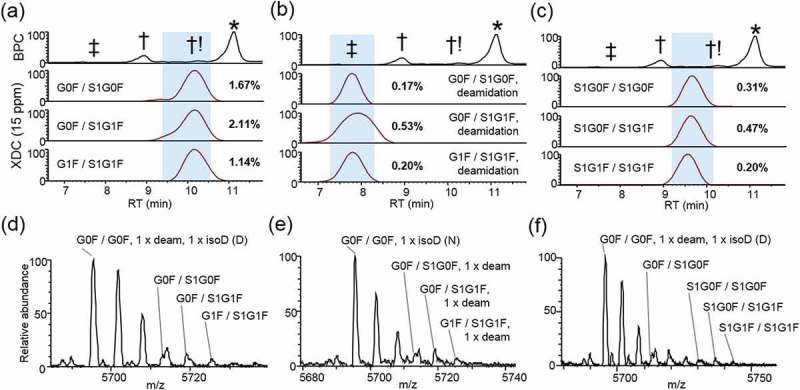
Figure 6.

Acidic low-abundance isoforms. XDC traces (15 ppm) are plotted for top 3 glycoforms in combination with (a) one sialic (neuraminic) acid (S1G0F or S1G1F)-containing N-glycan, (b) one sialic acid-containing N-glycan and one deamidation, or (c) two sialic acid-containing N-glycans. Abundance of each isoform is shown as a percentage relative to main-fraction adjusted XDC peak area of G0F/G0F. (d), (e), and (f) show mass spectra averaged across highlighted RT respectively in (a), (b), and (c).
