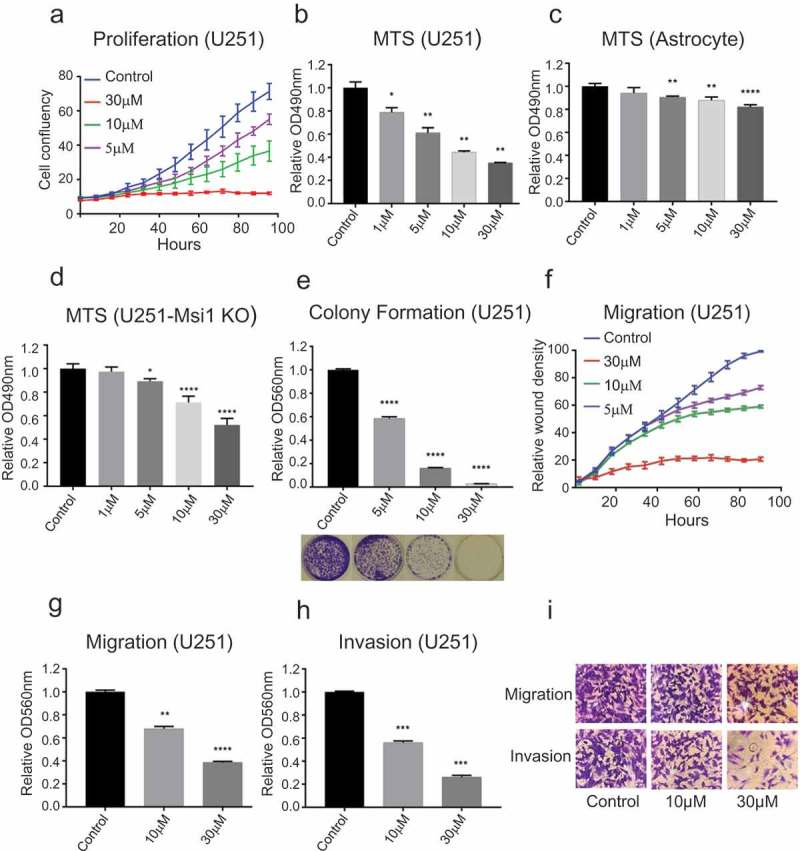
Figure 3.

Luteolin impact on cancer relevant phenotypes. a) The Essen Bioscience IncuCyte automated microscope system was used to follow proliferation of U251 glioblastoma cells over a period of 96 hours. Treatment with luteolin produced a reduction in cell proliferation. b) MTS assay shows a decrease in viability of U251 cells after treated with luteolin. c) To determine possible side effects of luteolin treatment, we analyzed its impact on the viability of astrocytes by MTS assay. The results indicate that astrocytes tolerate luteolin even at high concentrations. d) To determine if Msi1 is a key target of luteolin in glioblastoma cells, we conducted an MTS assay with U251 Msi1 knockout cells. The results show that luteolin has stronger effects on viability of U251 cells (B) in comparison to U251 Msi1 knockout cells. e) After treated with luteolin or diluent (DMSO), U251 cells were seeded and their capacity to form colonies was evaluated. Cells exposed to luteolin formed less and smaller colonies compared to control. f) An in vitro scratch assay was used to evaluate the impact of luteolin on the migration of U251 cells. The Essen Bioscience IncuCyte automated microscope system recorded the cell density of the wound over a period of 96 hours. The graph shows an obvious decrease in wound density of the luteolin-treated cells. g-i) Two kinds of chambers from Corning were used to measure the effect of luteolin on migration and invasion of U251 cells. After treatment with luteolin for 48 hours, cells were plated onto the upper chamber (containing serum-free medium). 24 hours later the invaded or migrated cells in the lower chamber (containing 10% FBS medium) were stained and extracted with acetic acid. The relative OD560nm was used to quantify the relative cell invasion or migration. The graph shows that fewer cells migrated and invaded from the upper chamber to the lower chamber after treatment with luteolin; the relative OD560nm was proportional to the concentration of luteolin. DMSO was used as control in all biological assays. All experiments were performed in triplicate. Statistical significance was calculated by one-way ANOVA and t test. All data are shown as means ± s.d. (*P < 0.05, **P < 0.005, ***P < 0.0005, ****P < 0.0001).
