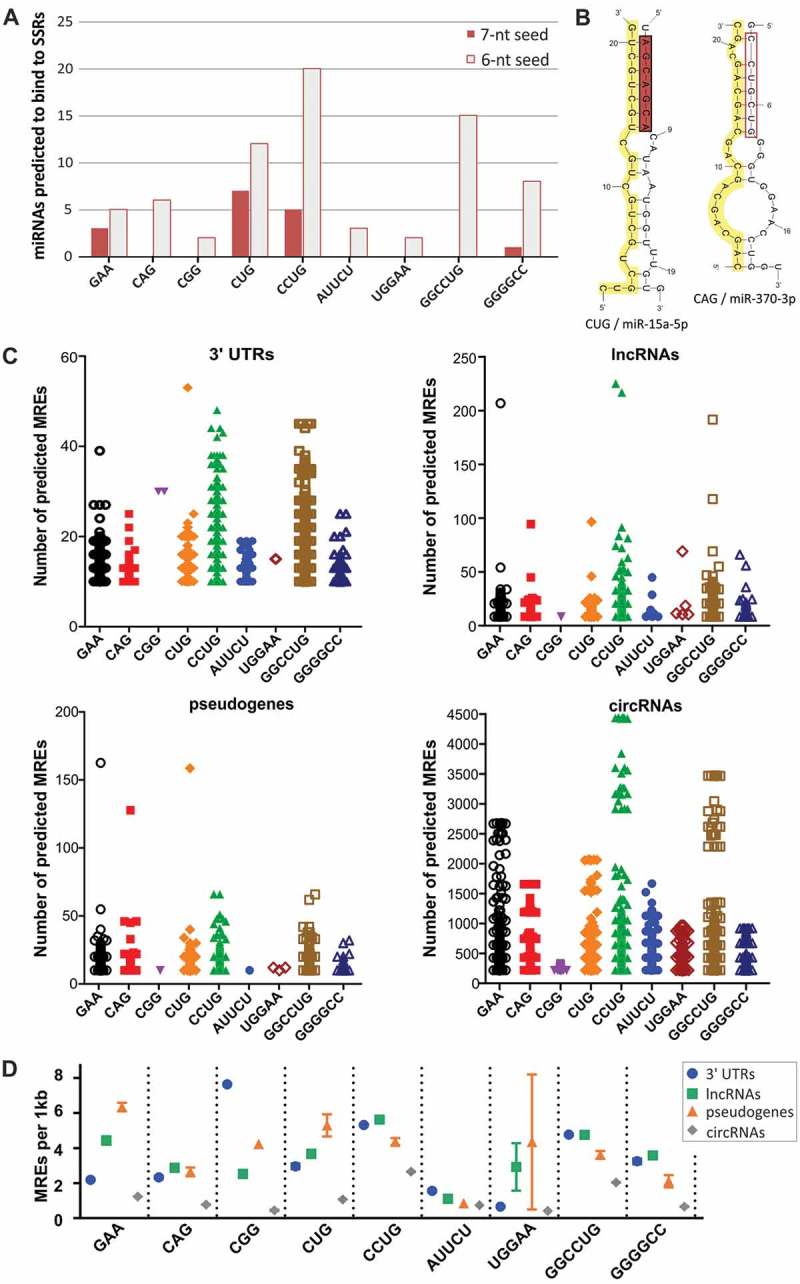
Figure 2.

Identification of miRNAs binding to SSR tracts. (A) Number of miRNAs predicted to bind to disease-relevant SSRs showing 7-nt and 6-nt complementarity to SSRs within their seed regions. (B) Secondary structure representations of complexes between CUG repeats and miR-15a-5p and between CAG repeats and miR-370-3p. SSR tracts are highlighted in yellow; miRNA seed regions are highlighted in red. (C) Distribution of the number of predicted MREs for miRNAs interacting with SSRs in the 3ʹ UTRs of protein-coding transcripts and in ncRNAs (lncRNAs, pseudogenes and circRNAs). Each point represents a single RNA; only RNAs with a minimum of 10 MREs are shown. (D) The density of predicted MREs was calculated as the number of MREs per 1 kb of the analyzed RNAs with multiple (minimum of 10) MREs and is depicted as the mean value with the SEM (symbols with bars).
