Figure 3.

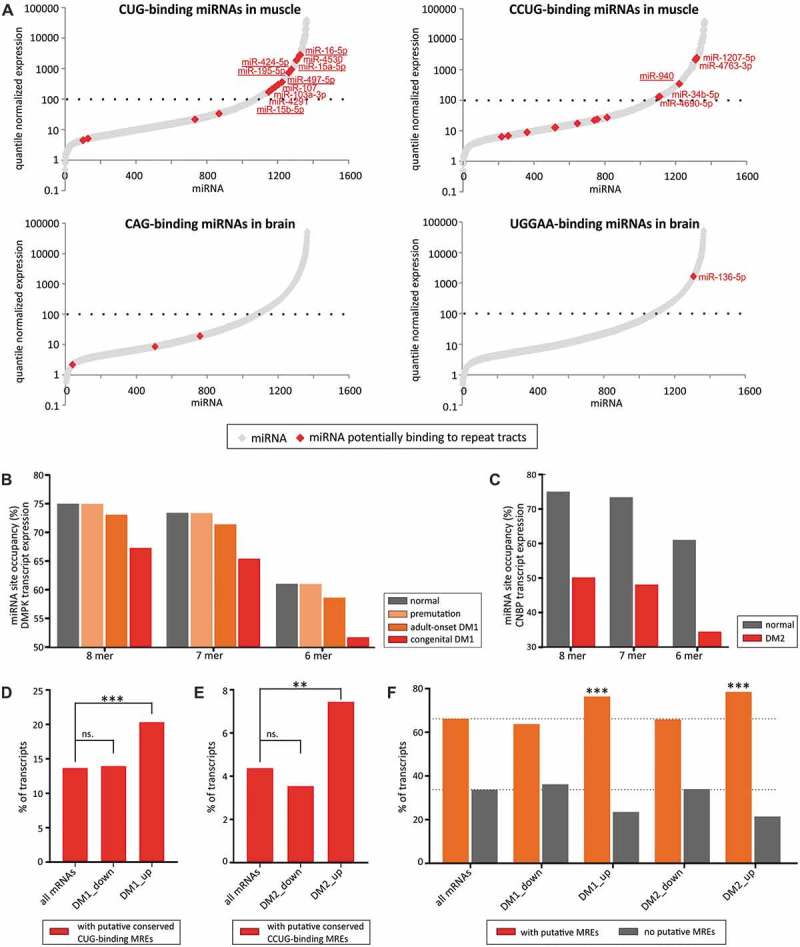
SSRs mediate raceRNA crosstalk. (A) Expression levels of CUG- and CCUG repeat-binding miRNAs in muscle (upper graphs) and expression of CAG and UGGAA repeat-binding miRNAs in the brain (lower graphs). Expressed miRNAs are depicted with gray diamond-shaped symbols; miRNAs binding to repeats are shown in red. MiRNAs showing 7-nt matching within the seed region are underscored. (B) Modeling of miRNA-mediated crosstalk between CUG repeats and a group of CUG-binding miRNAs (with a 6-nt AGCAGC seed region (hsa-miR-15a-5p, hsa-miR-15b-5p, hsa-miR-16-5p, hsa-miR-195-5p, hsa-miR-424-5p, hsa-miR-497-5p, hsa-miR-503-5p, hsa-miR-646 and hsa-miR-6838-5p)) in human myoblasts. The graph depicts the effects on miRNA site occupancy upon DMPK transcript expression (normal (~2 MREs), with premutation (~5 MREs), in adult-onset DM1 (60 MREs) or congenital DM1 (240 MREs)). (C) Modeling of miRNA crosstalk between CCUG repeats and a group of CCUG-binding miRNAs (with a 6-nt AGGCAG seed region (hsa-miR-34b-5p, hsa-miR-449c-5p, hsa-miR-940, hsa-miR-1910-3p, hsa-miR-2682-5p, hsa-miR-6808-5p, hsa-miR-6893-5p and hsa-miR-6511a-5p)) in human myoblasts. The graph depicts the effects on miRNA site occupancy upon of CNBP transcript expression (normal (3 MREs) or present in DM2 (800 MREs)). (D) The graph depicts the percentage of mRNAs bearing putative conserved MREs for conserved CUG-binding miRNAs in their 3ʹ UTRs in all human mRNAs and mRNAs downregulated or upregulated in DM1 patients (Supplementary Table III), *** − P-value < 0.001. (E) The graph depicts the percentage of mRNAs bearing putative conserved MREs for conserved CCUG-binding miRNAs in their 3ʹ UTRs in all human mRNAs and mRNAs downregulated or upregulated in DM2 patients (Supplementary Table III), ** − P-value < 0.01. (F) The graph depicts the percentage of mRNAs bearing putative conserved MREs for all conserved miRNAs in their 3ʹ UTRs in in all human mRNAs, mRNAs downregulated or upregulated in DM1 patients and mRNAs downregulated or upregulated in DM2 patients, *** − P-value < 0.001.
