
Figure 1.
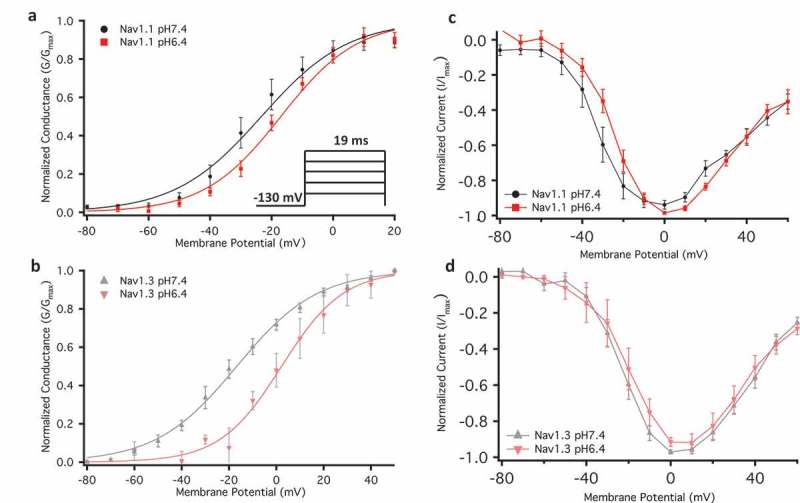
Normalized conductance plotted against membrane potential. (a-b) Show overlaps of Nav1.1 and Nav1.3 conductance at pH6.4 and 7.4. The inset in panel (a) shows voltage protocol used. (c-d) Normalized current and voltage relationships.
Official websites use .gov
A
.gov website belongs to an official
government organization in the United States.
Secure .gov websites use HTTPS
A lock (
) or https:// means you've safely
connected to the .gov website. Share sensitive
information only on official, secure websites.
Normalized conductance plotted against membrane potential. (a-b) Show overlaps of Nav1.1 and Nav1.3 conductance at pH6.4 and 7.4. The inset in panel (a) shows voltage protocol used. (c-d) Normalized current and voltage relationships.