
Figure 6.
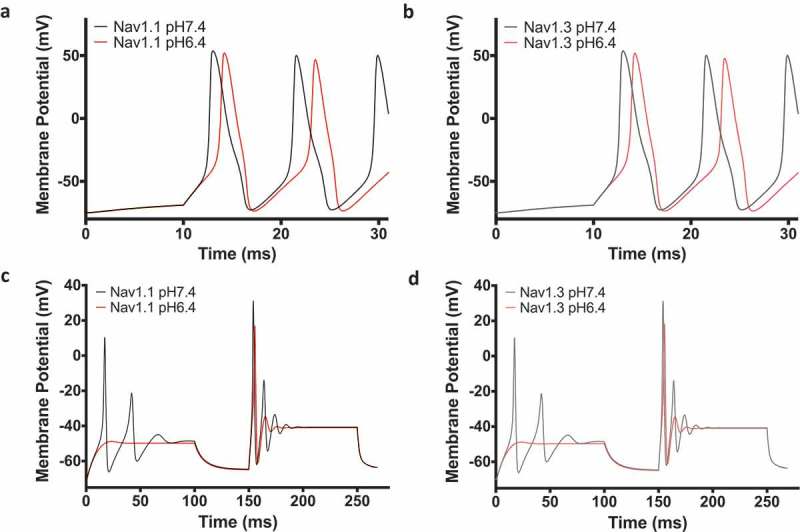
Action potential model. (a-b) Threshold level action potential simulation of Nav1.1 and Nav1.3 at pH7.4 and pH6.4. (c-d) Action potential simulations at increasing and sustained current injection intensities.
Official websites use .gov
A
.gov website belongs to an official
government organization in the United States.
Secure .gov websites use HTTPS
A lock (
) or https:// means you've safely
connected to the .gov website. Share sensitive
information only on official, secure websites.
Action potential model. (a-b) Threshold level action potential simulation of Nav1.1 and Nav1.3 at pH7.4 and pH6.4. (c-d) Action potential simulations at increasing and sustained current injection intensities.