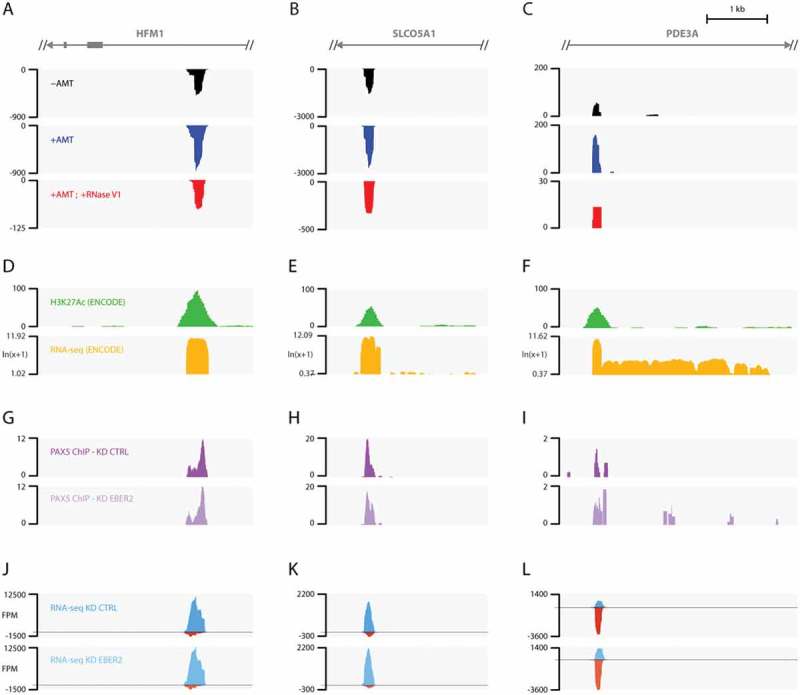
Figure 4.

EBER2 interacts with putative host enhancer RNAs. (A-C) Tracks after ASO-selection are shown for intronic regions of HFM1 (A), SLCO5A1 (B), and PDE3A (C) genes. Please see Table 1 for genome coordinates. (D-F) H3K27Ac and RNA-seq tracks provided by the ENCODE project on the UCSC genome browser. The EBER2-selection coverages overlap with H3K27Ac marks, a hallmark of active enhancers. RNA-seq tracks indicate robust transcription at these loci compared to surrounding regions. (G-L) PAX5 ChIP tracks (G-I) and RNA-seq data (J-L) of control (KD CTRL) and EBER2 knockdown (KD EBER2) BJAB-B1 cells. Detailed analyses of these tracks will be published elsewhere. These putative enhancer regions are bound by PAX5; their localization is not altered by EBER2 depletion. These loci are bi-directionally transcribed (blue and red tracks indicate transcription of Watson and Crick strand, respectively). Levels of these enhancer RNAs do not markedly change upon EBER2 knockdown. Note that EBER2 interacts with the less abundantly transcribed strand.
