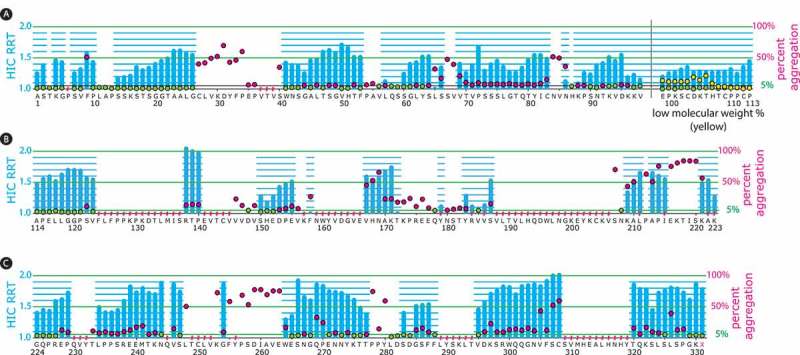
Figure 3.

Percent ADC aggregate and HIC relative retention times from an aldehyde tag scan of the heavy chain human IgG1 constant regions.
The aldehyde tag was inserted before each amino acid residue in the heavy chain constant regions. Tagged antibodies were expressed using a transient system, purified, and ADCs were generated through conjugation to a cytotoxic payload using a HIPS-functionalized non-cleavable linker. The ADC HIC relative retention time (RRT) values, calculated by dividing the HIC retention time for the DAR 2 species by that of the unconjugated antibody, are depicted with blue bars corresponding to the left y-axes as follows: Panel A, heavy chain CH1 and hinge domains to the left and right of the black vertical bar, respectively; Panel B, heavy chain CH2 domain; Panel C, heavy chain CH3 domain. The percent aggregate (high-molecular weight species) in the ADC preparations was determined by size-exclusion chromatography (SEC) and is depicted with green or red circles corresponding to the right y-axes. Green circles indicate ADCs with ≤ 5% aggregate, which was the cut-off that we set for manufacturability. Red circles indicate ADCs with > 5% aggregate. When the aldehyde tag was placed in the hinge region, low-molecular weight species were detected (depicted with yellow circles corresponding to the right y-axis). At some tag insertion sites, we could not obtain data for the corresponding ADCs (indicated with a red hash mark above the amino acid). This typically occurred because antibody titers (as detected by Protein A) at that position were insufficient (SEC) or because the ADC resolved poorly on HIC.
