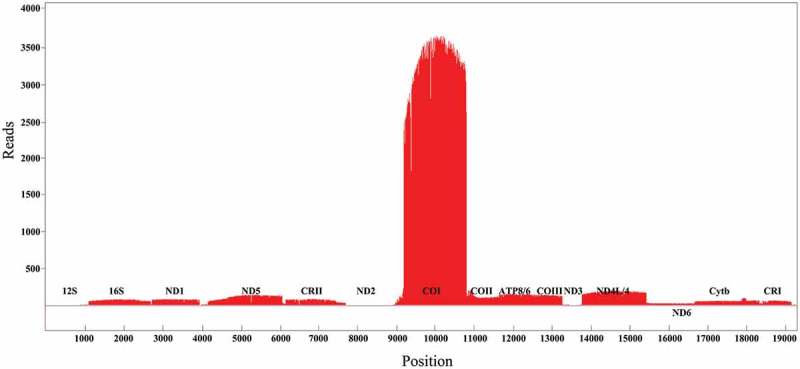
Figure 2.

The quantitative transcription map of P. megacephalum mitochondrial genomes. Alignments of transcripts on Heavy strand in red color were piled along the positive y-axis. Alignments of transcripts on Light strand in Green color were piled along the negative y-axis. tRNAs were not represented.
