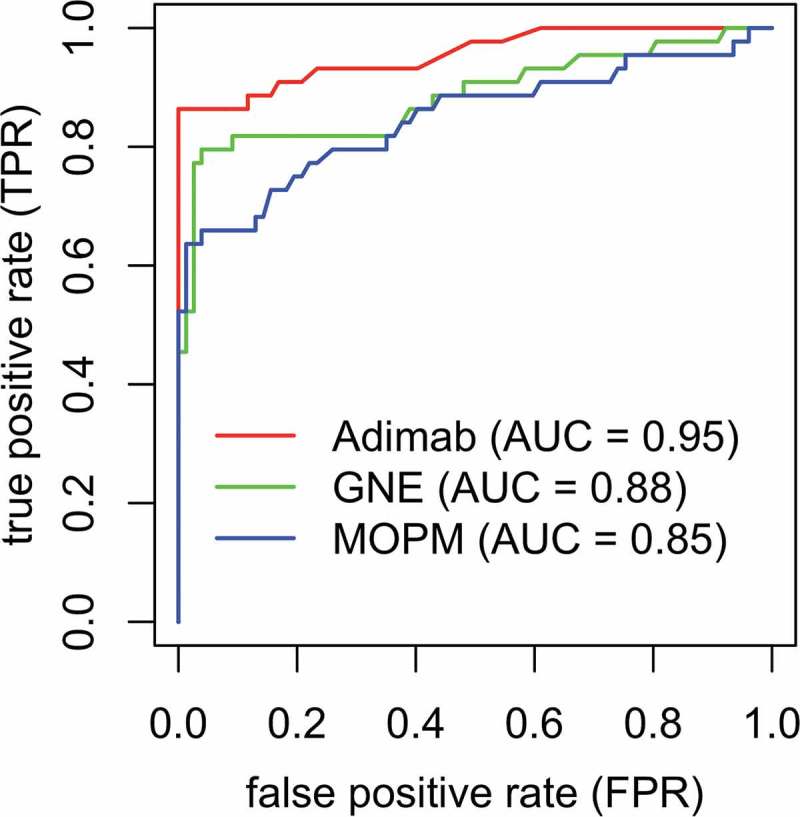
Figure 4.

Comparison of Receiver operating characteristic (ROC) curves for different methods on the benchmark clinical mAb dataset. Plot of the true positive rate (TPR) against the false positive rate (FPR) for our random forest-based prediction model (green) in comparison with that of Adimab (red) and MOPM (blue).
