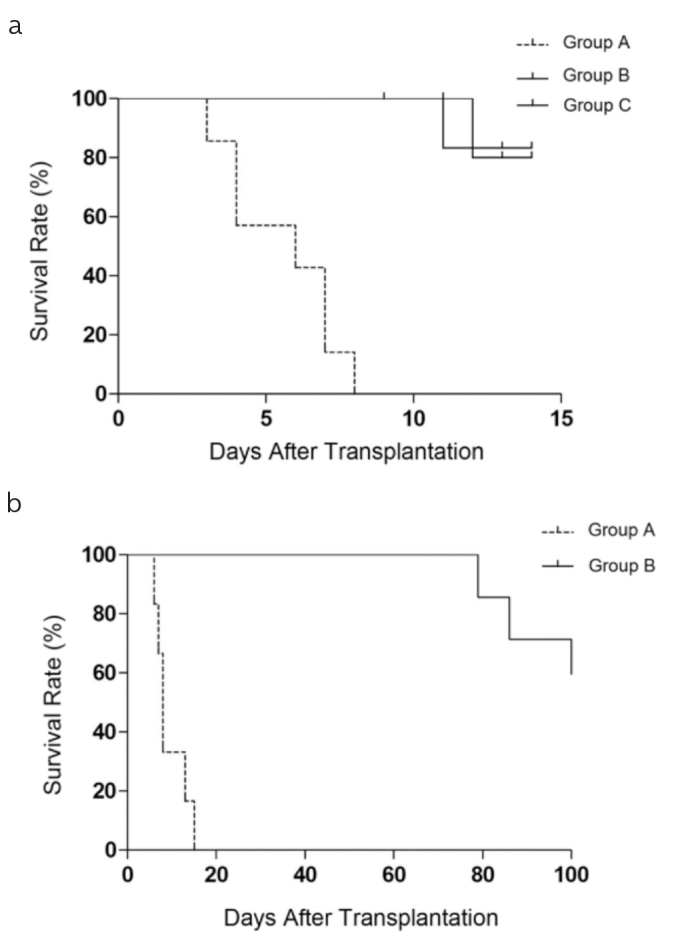
Figure 1. a, b .

The Kaplan-Meier survival curve of recipients. (a) Survival of the MSC-untreated mice (Group A) compared with that of the two control groups. (b) Survival rates were significantly increased in the MSC-treated mice (Group B) than in the MSC-untreated mice (Group A), and the number of animals at risk in this figure was 14.
