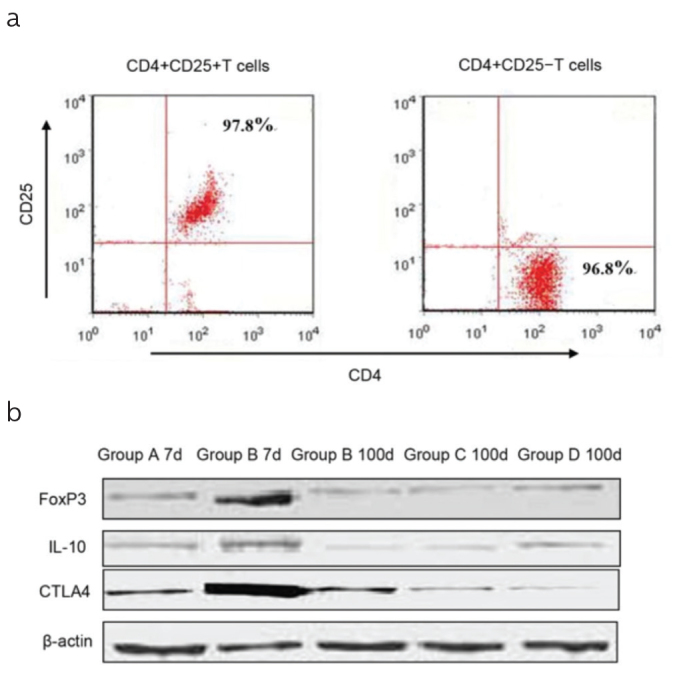
Figure 5. a, b.

(a) CD4+CD25+ T cells were sorted from the spleens by flow cytometry. The purity of these cells was >95%. The plots shown are representative results. (b) The expression of FoxP3, IL-10, and CTLA-4 in CD4+CD25+ T cells. At the indicated times, FoxP3, IL-10, and CTLA-4 of CD4+CD25+ T cells were measured using Western blot. On POD 7, the MSC-treated mice (Group B) showed significantly higher expression of FoxP3, IL-10, and CTLA-4, and this expression did not differ between the MSC-treated mice and the two groups of control mice on POD 100. Data are presented as mean±SD (*p<0.001; MSC-treated mice vs. all the other grafts grouped together).
