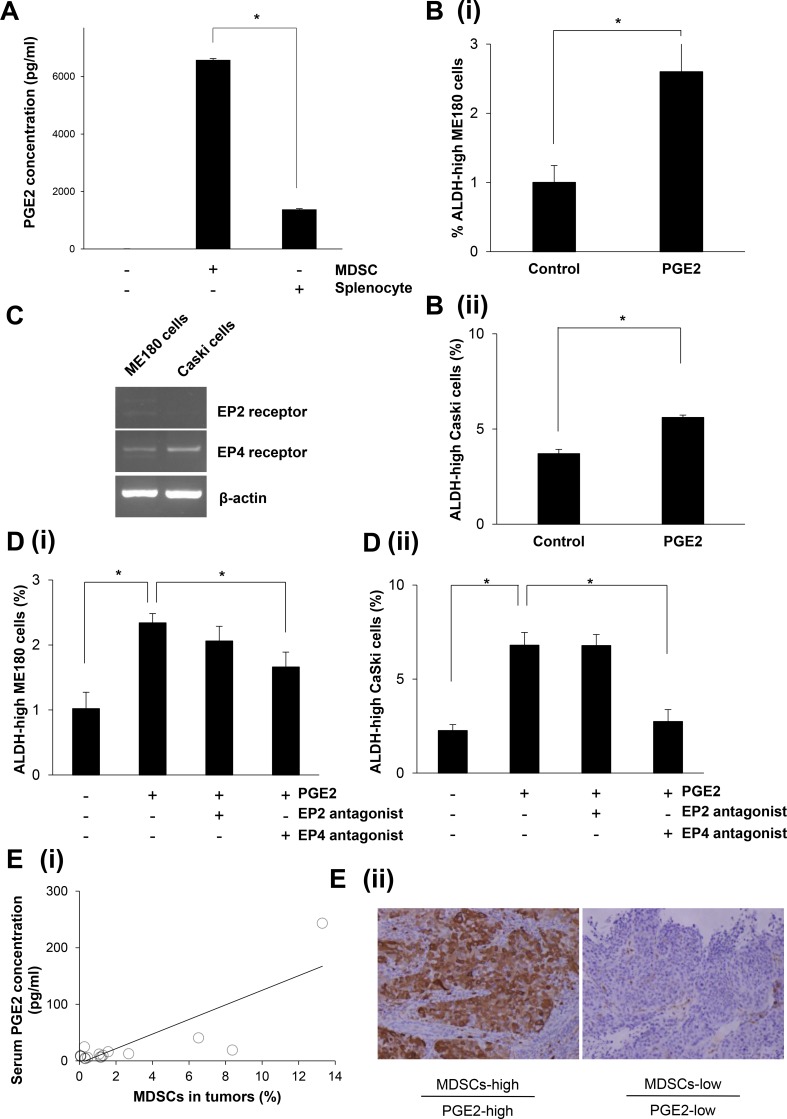
Figure 4. The mechanism responsible for the enhancement of stemness by MDSCs.
(A) Production of PGE2 by MDSCs. MDSCs that had been isolated from spleens of mice bearing ME180-GCSF-derived tumors were cultured in serum-free medium. Splenocytes (excluding MDSCs) were also used as a comparison. The PGE2 concentrations of the culture media were measured by the Prostaglandin E2 Express ELISA Kit. (Bars SD. n = 3, p < 0.01, two-sided Student’s t test). (B) Effect of PGE2 on the induction of cervical cancer CSCs in vitro. ME180 (i) or CaSki (ii) cervical cancer cells were treated with 0.1 μM of PGE2 in the absence of FBS for 18 hours in vitro. Then, the frequencies of ALDH-high ME180 cells were assessed using the Aldefluor assay. (Bars SD. n = 6, p < 0.01, two-sided Student’s t test). (C) Expressions of the EP2 or EP4 receptor in cervical cancer cells. The EP2 receptor, the EP4 receptor, and β-actin mRNA levels of ME180 cells and CaSki cells that had been incubated in the presence of 10% of FBS were assessed by RT-PCR. (D) Effect of EP2/EP4-inhibition on the PGE2-mediated CSC-induction. ME180 (i) or CaSki (ii) cervical cancer cells were treated either with 0.1 μM of PGE2, an EP2 antagonist, or an EP4 antagonist in the absence of FBS for 18 hours in vitro. Then, the frequencies of ALDH-high tumor cells were assessed using the Aldefluor assay. (Bars SD. n = 6, p < 0.05, two-sided Student’s t test). (E) (i) Correlation between the number of MDSCs (CD11b+CD33+HLA-DR- cells) and the serum PGE2 concentration in cervical cancer patients. Using biopsy samples that were obtained from cervical cancer patients at the initial diagnosis, CD11b+CD33+HLA-DR- cells were counted using flow cytometry. Blood samples were obtained from the same patients. Their serum PGE2 concentrations were measured using the Prostaglandin E Metabolite ELISA Kit. A positive correlation was detected (Spearman’s correlation coefficient, r = 0.×, p < 005). (ii) ALDH1 immunoreactivity in cervical cancer specimens. Cervical cancers obtained from patients exhibiting increased numbers of tumor MDSCs and elevated serum PGE2 concentrations (upper panel), and from those exhibiting decreased numbers of tumor MDSCs and low serum PGE2 concentrations (lower panel) were stained with anti-ALDH1 antibodies. Representative images of primary tumors are shown. (magnification: ×200).

