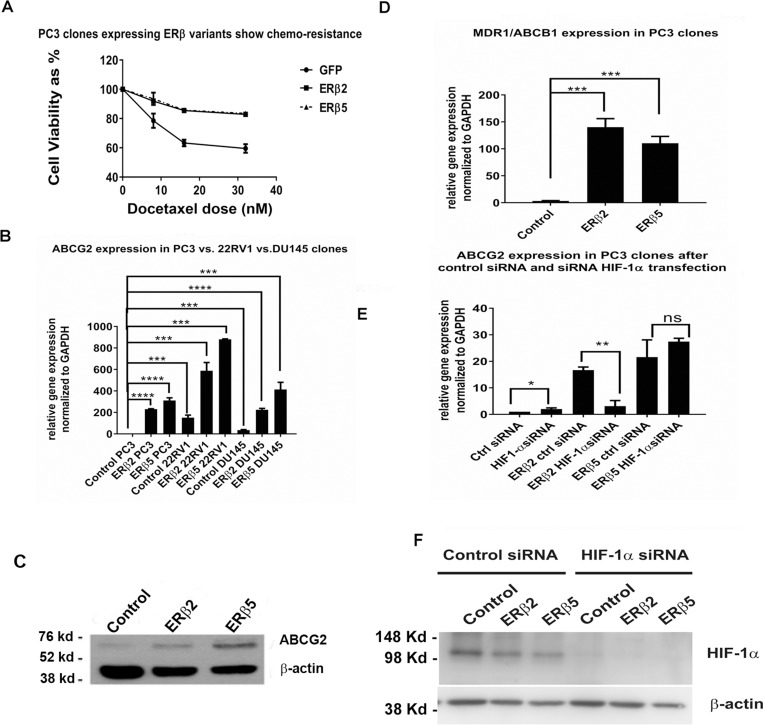
Figure 3.
(A) PC3 cells expressing the variants show more chemotherapy resistance than control cells. 1.5 × 10⁴ cells were plated onto each well in a 96 well plate in 100 µl of media containing increasing doses of docetaxel. Cells were incubated at 37° C, 5% CO2 for 48 hours and cell viability was assayed using MTS assay. (B) qPCR of ABCG2 in three prostate cancer cell lines stably expressing the variants (for expression levels of the variants see Supplementary Figure 4). (C) Western blot of ABCG2 protein in PC3 cells stably expressing ERβ2 or ERβ5 compared to control PC3 cells. (D) qPCR of ABCB1/MDR1 in PC3 cells stably expressing ERβ2 or ERβ5 compared to control PC3 cells. (E) HIF-1α siRNA and siLUC siRNA are transfected into PC3 cells expressing ERβ2 or ERβ5, expression of ABCG2 is determined using qPCR. (F) Western blot of hypoxia induced HIF-1α protein after transfection of control siLUC and HIF-1α siRNA.

