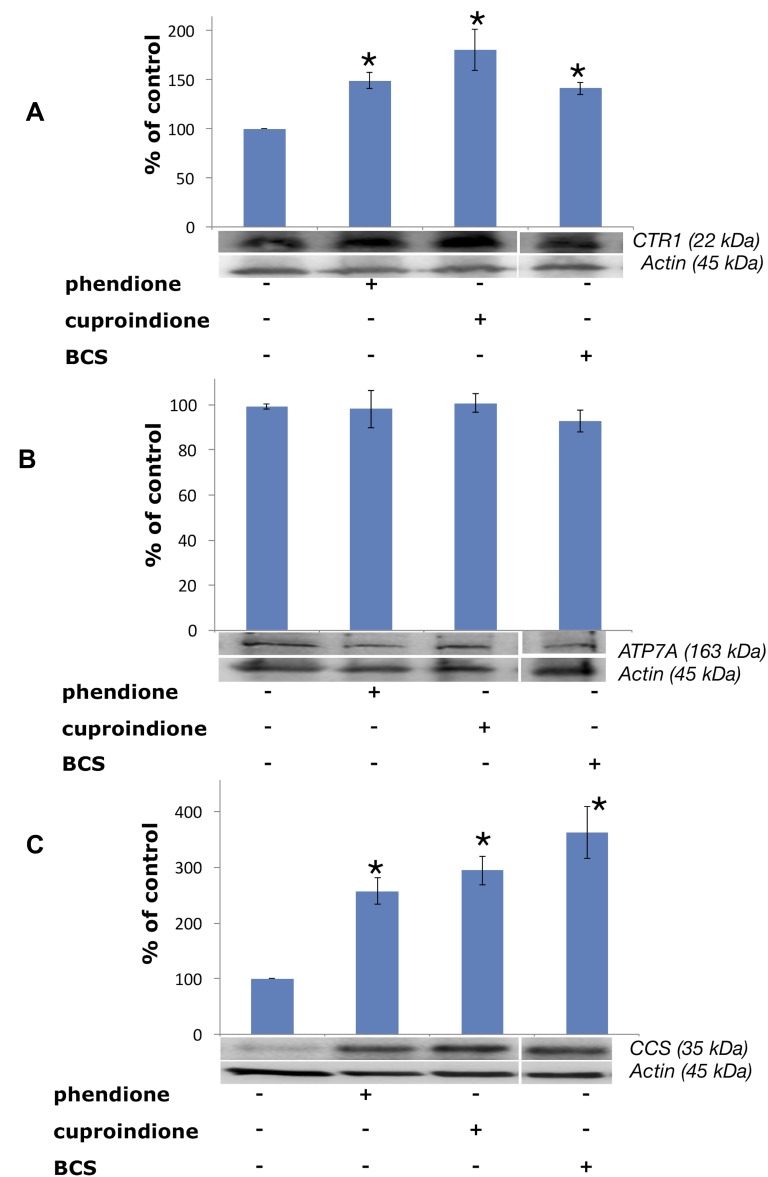
Figure 7.
Expression of CTR1 (A), ATP7A (B) and CCS (C) in SH-SY5Y cells after treatment with a phendione (IC50 concentration), cuproindione (IC50 concentration) and BCS (50 µM) for 48 hrs. Results are expressed as mean ± SEM over at least three independent experiments. (*p ≤ 0.05 level with respect to control, One-way Anova).

